Chapter 8 Developing a dynamic transmission model of Tuberculosis
8.1 Introduction
In the previous chapter (Chapter 7) I estimated the impact of the change in BCG policy on the subset of the population who were directly impacted. Unfortunately, the time horizon of this estimate was limited by the available data. Additionallly, if there is a non-negligible amount of Tuberculosis (TB) transmission amongst the UK born then any change in BCG vaccination policy will also have indirect impacts, via onwards transmission, not captured in this estimate. Both of these limitations can be overcome using a dynamic transmission model (see Chapter 1). This explicitly models the rate that individuals are infected using the mass action assumption.[7,8] A dynamic transmission model also allows estimates to be made of the long term impact of BCG policy changes, via model simulation.
This chapter presents the development and parameterisation of a dynamic model of TB transmission, incorporating BCG vaccination, in the UK born population of England. The key features of TB transmission, and BCG vaccination, are discussed with details of pertinent TB models given. An appropriate model structure for answering the study question is then outlined, along with a justification of the choices made and details of required sensitivity analyses. The model structure is then defined mathematically and parameterised using literature sources as well as data from the Enhanced TB Surveillance System (ETS), Labour Force Survey (LFS) and Office for National Statistics (ONS) (see Chapter 4). The assumptions made during model building and parameterisation are highlighted in preparation for evaluation during model fitting (Chapter 9).
8.2 Previously published TB models
The model presented in this chapter is not the first dynamic model of TB transmission in England to be developed or the first model to be developed that includes BCG vaccination. Vynnycky et al. developed a highly detailed - and rigorously parameterised - model of TB transmission in England and Wales.[99] However, unlike the model presented in this chapter, this model only included the white male population, it only modelled transmission until 1990, and it did not capture the full complexity of BCG vaccination. Harris et al. reviewed TB models that explored the impact of potential future vaccines.[100] They found that model structures evolved over time, with only a few models including the variable infectiousness of active disease, vaccine waning, and age stratification - all of which are included in the model presented in this chapter. Few of the models they evaluated considered low incidence settings, like England. The model presented in this chapter also makes use of recent advances in TB modelling that indicate which features are key to reproducing TB transmission dynamics.[101,102] Several previous studies have evaluated the role of BCG vaccination and considered various vaccination scenarios.[72,103–106] However, these studies either did not consider TB transmission or made use of simple transmission models that did not capture the full complexity of either TB transmission or BCG vaccination. Finally, the model presented in this chapter makes use of a highly detailed routine surveillance data set to provide setting appropriate prior distributions for key parameters that were not available for previous models. For further details of previous modelling approaches and their strengths and weaknesses in comparison to the model presented here please see the discussion section of this chapter.
8.3 Choice of model structure
When developing an infectious disease dynamic model there is a trade-off between reproducing reality and interpretability.[7] A model that includes all known features of a disease may not be able to answer questions of interest as it is too complex to interpret or because data does not exist to calibrate many of its parameters. A highly complex model, or indeed an overly simplistic one, may also be at risk of bias. The optimal model is therefore as parsimonious as possible, whilst still capturing the key features of a disease and making best use of all available data.[7] In this section the key features of TB, and BCG vaccination, that must be captured in order to produce meaningful output are discussed, as well as the features that can be excluded for this study question. Data from the ETS (Chapter 4) is used to support evidence from the literature. Further background information can be found in Chapter 2 and Chapter 4.
8.3.1 TB disease
The key features of TB transmission in England which must be captured in order to develop a methodologically sound model, are as follows:
- Latency - after an initial infection 5-10% of individuals develop symptomatic TB within 1-2 years. The majority of individuals enter a latent state in which they passively carry TB mycobacteria but are not symptomatic. Reactivation of the bacilli can then occur many years later due to a lose of immune control.[12] Simplistically latent TB may be modelled with a single latent compartment[107], more commonly an additional transition rate between the susceptible and active disease states is added.[108] This represents rapid progression to active disease, and slower progression via a low risk latent stage. Both of these model structures have been shown to not fit activation data well.[101,108] More complex structures that are commonly used incorporate either parallel or serial latency (Figure 8.1). Both of these structures incorporate both slow and fast latent periods and have been shown to produce identical activation dynamics.[101] This is unfortunate as they represent two disparate biological mechanisms, with the serial assumption representing decreasing risk over time for individuals and the parallel assumption suggesting that a subset of individuals are at a greater risk of developing active TB disease. For models that seek to investigate interventions targeted at latent cases this structural uncertainty is problematic. However, as BCG vaccination occurs prior to infection both structures will produce comparable results for study questions evaluating this intervention. The model presented here uses a serial latent structure. This is commonly used in the literature; simplifies modelling other aspects of TB; and has a plausible biological underpinning.[101]
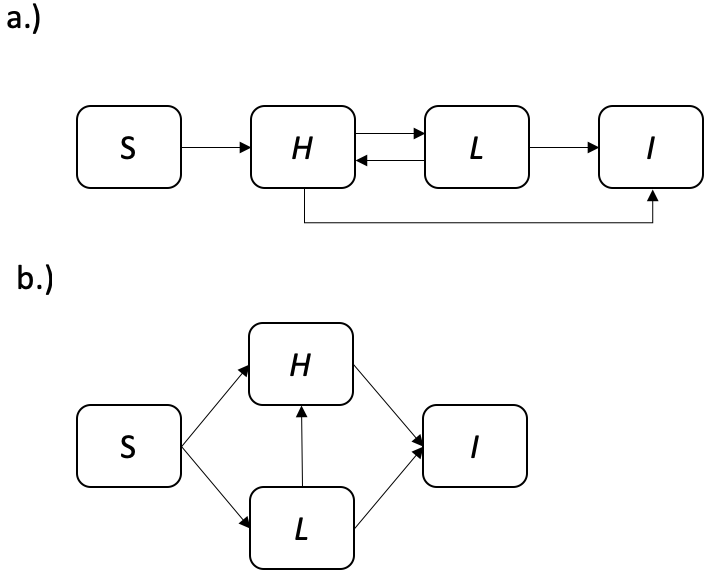
Figure 8.1: Flow diagrams of a.) the serial latency assumption and b.) the parallel latency assumption. The flow diagrams contain the following compartments; Susceptible (\(S\)), high risk latent (\(H\)), low risk latent (\(L\)), and infected (\(I\)). Solid arrows represent transition rates. Note that in both models repeated transmission to low risk latents is possible. This allows low risk latent cases to become high risk latent cases. For some varients of the parallel latency assumption, where it is assumed being high risk is inherent to individuals, this may not be appropriate.
Pulmonary/Extra-Pulmonary TB - active TB disease can be defined as any symptomatic TB infection but it may present with a range of diverse individual states. Commonly, TB cases are stratified into pulmonary and extra-pulmonary TB cases, with pulmonary cases being individuals who present with TB present in the lungs, and extra-pulmonary TB cases being cases that present with TB symptoms that do not involve the lungs (Chapter 2). Often pulmonary cases also present with extra-pulmonary symptoms. It is thought that pulmonary TB cases make up for the vast majority of TB transmission,[13,109] as TB is primarily spread by aerosol transmission, but that extra-pulmonary cases have worse outcomes. The proportion of pulmonary to extra-pulmonary cases has increased over time from 26.2% (1944/7410) in 1982 to 45.8% (2634/5748) in 2016. This may be attributed to the age distribution of TB cases changing, as different age-groups are more likely to progress to pulmonary TB than other age-groups.[110] It may also be related to the increase of non-UK born cases, as a higher proportion of non-UK born cases have extra-pulmonary disease only (51.4%, 2,103/4,089, in 2016), compared to UK born cases (31.9%, 467/1,465, in 2016).[2] The model presented here includes both pulmonary and extra-pulmonary cases, with only pulmonary cases contributing to onwards transmission. Extra-pulmonary cases are included so that the full impacts of any intervention can be correctly estimated.
Smear status - microscopic analysis of sputum smear samples for acid-fast bacilli is widely used as a means of diagnosis for TB. There is evidence that smear positive cases are responsible for the majority of transmission,[111] with smear negative cases contributing approximately 76% (95% CI 70%, 80%) less to transmission than smear positive cases.[112] The proportion of smear positive cases varies with age,[113] with 30.2% (95% CI 26.3%, 33.7%) in 0-14 year-olds, 65.2% (95% CI 64.2%, 66.2%) in 15-59 year-olds and 53.6% (95% CI 51.9%, 55.3%) in 60-89 year-olds in the ETS between 2000 and 2015. the model presented here includes sputum status via the force of infection.[7,8]
Re-infection - individuals with latent TB, or who have recovered from active TB, may be at risk of re-infection. It is thought that latent individuals gain some partial protection from prior infection but estimates for the magnitude of this protection vary widely.[114] A review of prospective cohort studies of persons exposed to individuals with infectious TB that was published prior to the widespread treatment of latent TB found that prior TB infection provided partial protection of 79% (70%, 86%).[115] This is included in the model presented below via a the force of infection.
Re-activation/Re-infection of recovered cases - individuals who have recovered from active TB disease are at risk of both re-infection and re-activation. As in many dynamic transmission models, this has been modelled here by treating recovered cases as having low risk latent TB.[116,117] This provides recovered cases with the same protection against re-infection as low risk latent cases. However, this means that vaccinated cases receive the benefits of BCG protection even after they have recovered from active TB disease.This may not be realistic but due to the low burden of TB in England is unlikely to lead to significant bias.
TB treatment - standard treatment consists of a 6 month course of multiple antibiotics, usually consisting of isoniazid, rifampicin, pyrazinamide and ethambutol. If treatment is unsuccessful using these first line drugs, second line drugs are then proscribed which have more severe side effects and a longer treatment regime (12-24 months).[2,18] Individuals on treatment may be considered non-infectious but are still at risk of negative outcomes including death. 4.9% (4847/98124) of cases in the ETS were lost to follow up within the first year of starting treatment between 2000 and 2014. A treatment term has been included in the model presented here along with potential treatment failure. Multi-stage treatment has not been modelled as this would add complexity but would not improve the models performance in other areas.
TB related mortality - within the first 12 months of starting treatment 6% (5884/98124) of cases, with complete data and who were evaluated, died in the ETS between 2000 and 2014. Of these 60.5% (1984/3290) had TB as a cause of death or had a cause of death that was related to active TB. The rate of TB mortality varies with age, with the very old and the very young at the greatest risk. Age-stratified TB mortality is important to include in any policy relevant model of TB transmission as reducing mortality is a major public health goal. There is little data on the rate of TB mortality in those untreated for TB, so all TB mortality will be modelled using a single, age stratified, term.
Age related presentation of TB - there is evidence to suggest that the risk of TB activation varies by age,[101] as does the proportion of cases that develop pulmonary TB,[110], the proportion of cases that are smear positive, and the risk of TB mortality. It may also be the case that the transmission probability varies by age, after accounting for the proportion of cases that are pulmonary and the proportion of cases that are smear positive. In the model presented here age has been included by stratifying the population into age-groups.
Demographic changes - TB dynamics develop over a long timespan, because of the potential for cases to develop active TB disease many years after infection. Over these long timespans population demographics can play an important role. An approach to include demographics is to link birth and death rates so that the modelled population is static over time. This has the advantage of making it easier to identify changes that are linked to the disease dynamics. In the model presented here birth and death processes have been incorporated based on available, age-specific, data. For years with available data this has the advantage of producing demographics which match those observed in the study population, allowing for policy relevant forecasts to be made. However, for years with limited data assumptions must be made about the likely birth and death rates (see 8.5.2.3).
Non-UK born TB Cases - TB incidence in England is highly heterogeneous with over 70% of cases occurring in the non-UK born population.[2] The age distribution of cases in the UK born and non-UK born populations differ, with the UK born population having a relatively uniform distribution. Meanwhile, the non-UK born have higher incidence rates in those aged 80 years and older (69.3 per 100,000 in 2016), those aged 75-79 years old (62.9 per 100,000 in 2016) and those aged 25-29 years old (61.6 per 100,000 in 2016).[2] Exposure to England’s BCG vaccination policy is difficult to assess for the non-UK born as is the degree of transmission occurring in the UK as opposed to cases being imported from abroad, or acquired from trips to cases countries of origin. For this reason the model presented here does not explicitly include non-UK born cases. Instead it imports non-UK born cases into the force of infection with a mixing parameter that controls the degree of contact between non-UK born cases and those born in the UK.[7,8]
8.3.2 BCG vaccination
The key features of the BCG vaccine that must be considered in order to forecast the impacts of vaccine policy are:
Protection from active disease - the BCG vaccine has been shown to primarily protect against the progression from latent to active TB disease (Chapter 2). It has been shown to be highly protective in children[4,23,24] but to have variable protection in adults ranging from 0-80%.[27] This variation in protection is thought to be linked to the equator with the vaccine becoming increasing effective at higher, and lower latitudes. In England, an MRC trial in the 1950s found that the BCG vaccine was highly effective.[26] There is little evidence to suggest that this has changed in the UK born population.
Duration of protection - BCG protection wanes with time, with the greatest protection shortly after vaccination. There is good evidence to suggest that the effectiveness of BCG vaccination lasts up to 15 years,[28] and a recent study suggests that this protection may last later into adulthood in the UK born.[29]
Protection from initial infection - there is evidence that the BCG vaccine provides partial protection against initial infection.[4] This may impact transmission dynamics. Not including it would lead to a higher proportion of latent cases in those vaccinated with BCG. One complicating factor is that the majority of the estimates of the protection offered by BCG vaccination from active TB disease include the protection from initial infection.
Age structure - BCG vaccination has previously been targeted at those at school-age and is currently targeted at neonates. There is also evidence that the effectiveness of BCG vaccination varies with age,[23,25] although there is little evidence of this in England. In order to answer questions relevant to BCG vaccination, TB disease must be modelled in young children and young adults. To capture the waning of BCG protection age structure must be modelled beyond these age groups.[28]
Non-UK born TB Cases - the majority of cases that occur in the non-UK born would not have been exposed to England’s BCG vaccination. In the majority of high incidence countries BCG vaccination is common, with most countries vaccinating young children as early in life as possible.[5] Based on this it could be assumed that all non-UK born cases were vaccinated at birth. However, this high level of coverage is unlikely. As the BCG vaccine has not been shown to decrease the likelihood of transmission from vaccinated TB cases assuming that all non-UK born cases are unvaccinated does not impact the dynamics in the modelled UK born population.
Additional benefits of BCG vaccination - there is some evidence that the BCG vaccine may reduce all-cause mortality both in the general population and specifically for TB cases (Chapter 6). There is weaker evidence that this reduction in all-cause mortality for TB cases may be associated with a reduction in TB specific mortality. This was not included in the model presented here as the evidence was not conclusive. This means the benefits of the BCG vaccine may have been underestimated.
8.4 A dynamic model of TB transmission
8.4.1 Model outline
The dynamic model of TB implemented here may be considered as 3 nested model these are: a TB transmission model; a demographic processes model; and a BCG vaccination model. For an overview of the model structure see the flow diagram (Figure 8.2) and for full details see the model equations (Section 8.4.2). Model parameters are discussed in detail in Section 8.5.2.
8.4.1.1 Disease model
The model includes the following compartments: Susceptible (\(S\)), high risk latent (\(H\)), low risk latent (\(L\)), active TB cases with pulmonary TB (\(P\)), active TB cases with extra-pulmonary TB disease only (\(E\)), pulmonary cases on treatment (\(T_P\)), and extra-pulmonary case on treatment (\(T_E\)). Cases that were previously infected and considered at low risk of developing active disease may be reinfected, although their latent infection provides partial protection. Treatment is assumed to be the only pathway to recovery for active TB disease, with a single rate used to model the heterogeneity of treatment times. A fraction of those on treatment are assumed to be lost to follow up, with these cases returned to active pulmonary or extra-pulmonary disease. Cases that start treatment immediately stop being infectious and upon treatment completion are treated as if they have low risk latent TB disease. TB mortality is included for both active TB cases on, and off, treatment. TB mortality is stratified by disease type and age. TB transmission is assumed to act under the mass action assumption.[7,8] Non-UK born cases are included into the force of infection.[7,8]
8.4.1.2 Demographic model
The model is stratified into 11 age groups with 5 year age groups from 0 to 49, a single age group from 50-69, and a single age group from 70 to 89. Older adults were grouped into larger age groups as they are thought to be responsible for a small amount of TB transmission and because fine scale BCG mechanisms do not need to be modelled in these age groups. Adults aged 90+ were not modelled due to large amounts of uncertainty in the demographic data and because cases in this population represent a small fraction of total TB cases (see Chapter 4). The number of births in a given year is incorporated as a time varying parameter. The natural mortality rate is also allowed to vary with time and is stratified by age. Immigration and emigration were not included in the demographic model as reliable age stratified data were unavailable and it is unlikely that either immigration or emigration of the UK born population is a significant driver of overall population size, or structure.
8.4.1.3 Vaccination model
The vaccination model is nested into the demographic process model and therefore vaccination is possible upon entry to each modelled age group. The target age group can be varied to represent changing BCG vaccination policy. The vaccinated population is then modelled explicitly throughout all disease compartments. The primary action of the BCG vaccine is to prevent the transition from latent to active disease, this is included for both high and low risk latent cases. Waning vaccination effectiveness has been included by stratifying vaccine effectiveness by age group. The partial protection offered by BCG vaccination against initial infection has been included as a modifier on the protection from latent to active disease and as a modifier on the proportion of cases that are initially infected. This allows estimates of the effectiveness of BCG vaccination at preventing active TB disease in the susceptible population to be used, as these estimates have the most robust data sources. It is assumed that latently infected individuals do not gain additional protection from re-infection from the BCG vaccine. The BCG vaccine has been modelled as being partially protective for all individuals rather than as a “take” vaccine (i.e all or nothing protection). This assumption simplifies the model and will not impact the dynamics of TB transmission, assuming that protected and unprotected BCG vaccinated individuals obey the mass action assumption (See Chapter 1 and [7,8]).

Figure 8.2: Flow diagram for the dynamic TB disease model with demographics and vaccination described. The TB model contains the following compartments; Susceptible (\(S\)), high risk latent (\(H\)), low risk latent (\(L\)), active cases with pulmonary TB (\(P\)), active TB cases with extra-pulmonary TB only (\(E\)), pulmonary cases on treatment (\(T_P\)), and extra-pulmonary cases on treatment (\(T_E\)). The vaccinated (\(v\)) and unvaccinated (\(u\)) populations are represented by \(k\), such that \(k = u,v\). Age stratification is represented by \(a\) (where \(a = 1, 2, ...,11\)) in the disease model and the \(0, 1, 2, 3\) subscripts in the demographic model. Each age groups spans 5 years (i.e \(0-4\), \(5-9\), \(10-14\), …) up to 49 years old, with a single age group for those aged 50-69 years old and those aged 70-89 years old. Individuals aged \(90+\) are not explicitly modelled. In the demographic and vaccination model the A compartment represents the demographic processes modelled in all population compartments except for the vaccinated and unvaccinated susceptible populations. Solid arrows represent transition rates within the modelled populations and dashed arrows represent transition rates into, or out of the modelled populations (i.e birth and death processes).
8.4.2 Model equations
In order to simplify the model equations the disease (d) and demographic and vaccination models (p) have been separated such that (where \(C = S,\ H,\ L,\ P,\ E,\ T_P,\ T_E\)),
\[\begin{equation} \frac{dC}{dt} = J_{d} + J_{p} \tag{8.1} \end{equation}\]
The disease model (\(J_{d}\)) is then defined as,
\[\begin{equation} \frac{dS^{kd}_{a}}{dt} = - (1 - \chi^k_a)\lambda_a S^k_a \tag{8.2} \end{equation}\]
\[\begin{equation} \frac{dH^{kd}_{a}}{dt} = (1 - \chi^k_a)\lambda_a S^k_a + (1 - \delta)\lambda_a L^k_{a} - (1 - \alpha^k_a)\epsilon^a_H H^{k}_{a} - \kappa_a H^{k}_{a} \tag{8.3} \end{equation}\]
\[\begin{equation} \frac{dL^{kd}_{a}}{dt} = \kappa_a H^{k}_{a} - (1 - \delta)\lambda_a L^k_{a} - (1 - \alpha^k_a) \epsilon^a_L L^{k}_{a} + \phi_a (T^{k}_{Pa} + T^{k}_{Ea}) \tag{8.4} \end{equation}\]
\[\begin{equation} \frac{dP^{kd}_a}{dt} = \Upsilon_a(1 - \alpha^k_a)(\epsilon^a_HH^{k}_{a} + \epsilon^a_LL^{k}_{a}) + \zeta_a T^{k}_{Pa} - \nu_a^P P^{k}_a - \mu^P_a P^{k}_a \tag{8.5} \end{equation}\]
\[\begin{equation} \frac{dE^{kd}_a}{dt} = (1 - \Upsilon_a)(1 - \alpha^k_a)(\epsilon^a_HH^{k}_{a} + \epsilon^a_LL^{k}_{a}) + \zeta_a T^{k}_{Ea} - \nu_a^E E^{k}_a - \mu^E_a E^{k}_a \tag{8.6} \end{equation}\]
\[\begin{equation} \frac{dT^{kd}_{Pa}}{dt} = \nu_a^P P^{k}_a - \zeta_a T^{k}_{Pa} - \mu^P_a T^{k}_{Pa} - \phi_a T^{k}_{Pa} \tag{8.7} \end{equation}\]
\[\begin{equation} \frac{dT^{kd}_{Ea}}{dt} = \nu_a^E E^{k}_a - \zeta_a T^{k}_{Ea} - \mu^E_a T^{k}_{Ea} - \phi_a T^{k}_{Ea} \tag{8.8} \end{equation}\]
Where the unvaccinated (\(u\)) and vaccinated (\(v\)) populations are represented by \(k = u,v\) and age groups are represented by \(a=0,1,2,3, ... 11\). The disease model parameters are defined as follows: \(\lambda_a\) is the force of infection; \(\epsilon_a\) is the rate of activation from each latent population; \(\kappa_a\) is the rate of transition into the low risk latent population; \(\nu_a\) is the rate of starting treatment; \(\delta\) is the protection from re-infection conferred by prior latent infection; \(\Upsilon_a\) is the proportion of cases that develop pulmonary TB, with or without extra-pulmonary TB; \(\mu^{P,E}_a\) is the mortality from active pulmonary (\(P\)) and extra-pulmonary (\(E\)) TB; \(\zeta_a\) is the rate of treatment failure; \(\phi_a\) is the rate of successful treatment; \(\alpha_a\) is the effectiveness of the BCG vaccine at preventing active TB disease; and \(\chi^k_a\) is the protection inferred due to vaccination from initial infection. In the unvaccinated population (when \(k=u\)) \(\alpha^u_a = 0\) and \(\chi^u_a = 0\). Parameters with an \(a\) subscript, or superscript, are age-stratified.
The demographic and vaccination model (\(J_{p}\)) is then defined as (\(A = H,\ L,\ P,\ E,\ T_P,\ T_E\)),
\[\begin{equation} \frac{dS^{up}_{a}}{dt} = (1 - \text{sgn}(a)) (1 - \gamma_a)\omega(t) + \text{sgn}(a) (1 - \gamma_a)\theta_{a - 1} S^u_{a - 1} - \theta_a S^u_a -\mu_{a}(t) S^u_a \tag{8.9} \end{equation}\]
\[\begin{equation} \frac{dS^{vp}_{a}}{dt} = (1 - \text{sgn}(a)) \gamma_a\omega(t) + \text{sgn}(a)\gamma_a\theta_{a - 1} S^u_{a - 1} - \theta_a S^v_a -\mu_{a}(t) S^v_a \tag{8.10} \end{equation}\]
\[\begin{equation} \frac{dA^{kp}_{a}}{dt} = \text{sgn}(a)\theta_{a - 1} A^k_{a - 1} - \theta_a A^k_{a} - \mu_{a}(t) A^k_{a} \tag{8.11} \end{equation}\]
Where \(\omega(t)\) is the time varying number of births, \(\gamma_a\) is the age-specific proportion that are vaccinated, \(\theta_a\) is the rate of ageing, and \(\mu_a(t)\) is the time varying natural mortality rate.
The signum function used above is defined as follows; \[\begin{equation} \text{sgn}(x) := \begin{cases} 0 & \text{if } x = 0, \\ 1 & \text{if } x > 0. \end{cases} \tag{8.12} \end{equation}\]
Code for this model is available online.27
8.4.3 Force of infection
The force of infection (\(\lambda^k_a\)) is the rate at which susceptible individuals are infected. Here it is defined using the law of mass action which assumes that infectious cases and susceptible cases randomly mix with the rate of mixing being determined by the fraction of the population that are susceptible, the transmission probability, and the contact rate.[7,8] It is age stratified (\(a\), \(A = \text{max}(a)\)) by contact rates, by the proportion of cases that are smear positive in a given age group, by the transmission probability of each case, and by the rate of starting treatment. Stratification by vaccine status (\(k\)) is introduced by the number of current pulmonary TB cases. It can be defined as follows,
\[\begin{equation} \lambda_a = \frac{\beta_a}{N_a} \sum\limits_{i=1}^{A} \rho_i C_{ai}\left(\frac{M_{i}\iota_i}{\nu_i^P} + \sum\limits_{j = u,v}P^j_i\right) \tag{8.13} \end{equation}\]
Where \(\iota_i\) is the age stratified number of non-UK born pulmonary cases notified in a given year, \(P^{u,v}_i\) is the number of vaccinated, and unvaccinated, pulmonary TB cases, \(\rho_i\) is the age-specific proportion of cases that are smear positive, \(\nu^P_i\) is the age-specific rate of starting treatment for active pulmonary TB, \(C_{ai}\) is the age-stratified contact matrix (Section 8.5.2.1.5), \(\beta_a\) is the age-stratified transmission probability, \(N_a\) is the number of people in age group \(a\), and \(M_i\) is the age-stratified mixing rate between the UK born and non-UK born population. Non-UK born cases pulmonary cases (\(\iota_i\)) are included in the the force of infection, along with their own mixing rate (\(M_i\)), and the duration of time spent infectious (\(\frac{1}{\nu^P_i}\)) so that their external forcing on UK born cases is modelled (Section 8.3). A separate mixing rate (\(M_i\)) is used as the extent of this forcing is not known. Both UK born and non-UK born pulmonary TB cases are multiplied by the proportion of cases that are smear positive (\(\rho_i\)) as it is thought that these cases are responsible for the majority of onwards transmission (Section 8.3).
8.5 Parameterisation and data synthesis
Parameters distributions were either estimated from the available data, assumed based on common values found in the literature, or based on expert opinion. Parameter distributions were assumed to be normal unless otherwise stated. Where no comparable estimates were found in the literature, and data was not available, a largely uninformative distribution was used, informed where possible by expert opinion. Normal distributions were extrapolated based on published confidence/credible intervals for prior distributions based on literature sources. All prior distributions were truncated to be greater than or equal to 0 with proportions further truncated to be less than or equal to 1. Prior distributions are first summarised in tables stratified by submodel, with additional details on their derivation given in the subsequent sections. Code for all prior derivations is available online28. The data sources used to estimate model parameters have been detailed although for the ETS and the LFS more detail is provided elsewhere (Chapter 4).
8.5.1 Data sources
8.5.1.1 Enhanced TB Surveillance System
Model parameters were estimated using the ETS system where possible, with data on all notified cases in England from Jan 1, 2000 to Dec 31, 2015. The ETS is a robust national surveillance network that collects demographic, clinical, and microbiological data; a yearly report is published detailing data collection, cleaning, and trends in TB incidence (Chapter 4).[2]
8.5.1.2 Labour Force Survey
Yearly population estimates, stratified by age and UK birth status, were extracted from the April to June LFS from 2000 to 2015. As detailed previously (Chapter 4) the LFS is a study of the employment circumstances of the UK population, providing the official measures of employment and unemployment in the UK. As the LFS is based on a sample the population estimates are subject to sampling errors.
8.5.2 Model Parameters
8.5.2.1 Disease model parameters
Details of the prior distributions used for each disease model parameter are given in Table 8.1. Table 8.2 contains details of the sources used to parameterise the model. More detail is given in the following sub-sections.
| Parameter | Description | Distribution | Units | Method | Type |
|---|---|---|---|---|---|
| \(C_{\text{eff}}\) | The assumed effective number of contacts per infectious TB case. | \(\mathcal{N}(1, 1)\) |
|
Estimated using a dynamic model of TB transmission in England which found an effective contact rate of 1 in 1990. A conservative interval has then been applied. | Vynnycky et al. |
| \(C^{\text{hist}}_{\text{eff}}\) | The assumed historic effective number of contacts per infectious TB case. | \(\mathcal{U}(C_{\text{eff}}, 20)\) |
|
Estimated using a dynamic model of TB transmission in England which found an effective contact rate of 1 in 1990 and 20 in 1901. A conservative interval has been chosen to represent the parameter uncertainty. It has been assumed that the historic contact rate is bounded below by the current contact rate. | Vynnycky et al. |
| \(C^{\text{half-life}}_{\text{eff}}\) | It is assumed that the historic effective contact rate decays from 1935 to 1980 with a rate of \(C^{\text{half-life}}_{\text{eff}}\). | \(\mathcal{N}(5, 5)\) |
|
The prior distribution is informed by historic TB notifications. | Assumption |
| \(\beta_{\text{young-adult}}\) | This parameter modifies the effective contact rate in scenarios when the transmission probability is modified for young adults (15-24). | \(\mathcal{U}(0, 10)\) |
|
An uninformative prior has been used bounded above to restrict the transmission probability in young adults to be no greater than 10 times that in other age-groups. | Assumption |
| \(\Upsilon\) | The age-specific proportion of cases that have pulmonary TB | \(\Upsilon_{0-14} = \mathcal{N}(0.629, 0.00101)\), \(\Upsilon_{15-59} = \mathcal{N}(0.706, 0.00411)\), \(\Upsilon_{60-89} = \mathcal{N}(0.750, 0.00569)\) | Proportion | Estimated using the age-specific proportion of cases that had pulmonary TB in the ETS. | ETS |
| \(\rho\) | The age-specific proportion of pulmonary TB cases that are smear positive | \(\rho_{0-14} = \mathcal{N}(0.302, 0.0189)\), \(\rho_{15-59} = \mathcal{N}(0.652, 0.00518)\), \(\rho_{60-89} =\mathcal{N}(0.536, 0.00845)\) | Proportion | Estimated using the age-specific proportion of pulmonary TB cases that were smear postive in the ETS. | ETS |
| \(C\) | Matrix of contact rates between each age group |
|
Non-unique yearly contacts. | For each parameter sample a contact matrix was bootstrapped from the POLYMOD survey data, standardised using the UK born population in 2005, and then averaged to provided a symmetric contact matrix. | Mossong et al. |
| \(\iota(t)\) | The age-specific number of non-UK born pulmonary TB cases in England each year |
|
Cases | The number of pulmonary non-UK born cases for each year were extracted from the ETS and grouped by age. | ETS |
| \(\iota_{\text{scale}}\) | Scaling parameter for the importation of non-UK born cases between 1960 and 2000. | \(\mathcal{U}(0, 200)\) |
|
This largely uninformative prior range was chosen so that non-UK born scaling can vary between approximately linear to approximately constant. | Assumption |
| \(M\) | The proportion of mixing between the UK born and non-UK born population. | \(\mathcal{N}(1, 1)\) | Proportion | Any degree of mixing is allowed as there is little data on which to base this estimate. Mixing greater than 1 is allowed as this is used to represent non-UK born cases being in some way more infectious than non-UK born cases. | Assumption |
| \(M_{\text{young-adult}}\) | This parameter modifies the non-UK born mixing rate in scenarios when \(M\) is modified for young adults (15-24). | \(\mathcal{U}(0, 10)\) |
|
An uninformative prior has been used bounded above to restrict non-UK born mixing in young adults to be no greater than 10 times that in other age-groups. | Assumption |
| \(\chi\) | Age-specific protection from infection with TB due to BCG vaccination | \(\chi^v_{i} = \mathcal{N}(0.185\), \(0.0536)\), where \(i\) is the age group vaccinated. | Proportion | A meta-analysis of the protection from infection due to BCG vaccinatiion in children. It has been assumed that there is no reduction in protection in UK born adults. Distribution derived by the assumption of a normal distribution based on published 95% confidence intervals. | Roy et al. |
| \(\epsilon_H\) | The age-specific rate of transition to active disease during high risk latent period. | \(\epsilon_H^{0-4} = \mathcal{N}(0.00695, 0.00130)\), \(\epsilon_H^{5-14} = \mathcal{N}(0.0028, 0.000561)\), \(\epsilon_H^{15-89} = \mathcal{N}(0.000335, 0.0000893)\) | \(days^{-1}\) | From fitting a similar model to contact data in Australia, and Holland. Distribution derived by the assumption of a normal distribution based on published 95% credible intervals. | Ragonnet et al. |
| \(\kappa\) | The reciprocal of the age-specific average high risk latent period. | \(\kappa^{0-4} = \mathcal{N}(0.0133, 0.00242)\), \(\kappa^{5-14} = \mathcal{N}(0.0120, 0.00207)\), \(\kappa^{15-89} = \mathcal{N}(0.00725, 0.00191)\) | \(days^{-1}\) | From fitting a similar model to contact data in Australia, and Holland. Distribution derived by the assumption of a normal distribution based on published 95% credible intervals. | Ragonnet et al. |
| \(\epsilon_L\) | The reciprocal of the age-specific average low risk latent period. | \(\epsilon_L^{0-4} = \mathcal{N}(8.00e^{-6}, 4.08e^{-6})\), \(\epsilon_L^{5-14} = \mathcal{N}(9.84e^{-6}, 4.67e^{-6})\), \(\epsilon_L^{15-89} = \mathcal{N}(5.95e^{-6}, 2.07e^{-6})\) | \(days^{-1}\) | From fitting a similar model to contact data in Australia, and Holland. Distribution derived by the assumption of a normal distribution based on published 95% credible intervals. | Ragonnet et al. |
| \(\epsilon^{\text{older-adult}}_L\) | This parameter modifies the activation rate of low risk latent cases who are 70+ and reduces the activaton rate for other adults so that the mean activation rate is \(\epsilon_L^{15-89}\) | \(\mathcal{N}(2, 0.5)\) |
|
Evidence suggests that activation risk increases when individuals enter old age. A largely uninformative prior has been used centred around an increase in risk of double the average rate. | Horsburgh, Jr. et al. |
| \(\alpha_i^T\) | The BCG vaccine effectiveness at preventing the development of active TB disease in a TB free population | \(\alpha^T_{j} = 1 - e^{\alpha^{\text{ln}(T)}_{j}}\), where \(\alpha^{\text{ln}(T)}_{j = i} = \mathcal{N}(-1.86, 0.22)\), \(\alpha^{\text{ln}(T)}_{j = i+5} = \mathcal{N}(-1.19, 0.24)\), \(\alpha^{\text{ln}(T)}_{j = i+10} = \mathcal{N}(-0.84, 0.22)\), \(\alpha^{\text{ln}(T)}_{j = i+15} = \mathcal{N}(-0.84, 0.2)\), \(\alpha^{\text{ln}(T)}_{j = i+20} = \mathcal{N}(-0.28, 0.19)\), $ ^{(T)}_{j = i+25} = (-0.23, 0.29))$ and \(i\) is the age group vaccinated | Proportion | Poisson regression used to calculate Risk Ratios from literature values. A distribution is then found using the log normal approximation. Effectiveness estimates are caculated using 1 minus the exponentiated log normal distribution. | Hart et al. and Mangtani et al. |
| \(\delta\) | Reduction in susceptibilty to infection for low risk latent cases. | \(\mathcal{N}(0.78\), \(0.0408)\) | Proportion | A review of prospective cohort studies of persons exposed to individuals with infectious tuberculosis that was published prior to the widespread treatment of latent tuberculosis. Distribution derived by the assumption of a normal distribution based on published 95% confidence intervals. | Andrews et al. |
| \(\nu^{P, E}\) | The reciprocal of the average infectious period | \(\nu^P_{0-14} = \mathcal{N}(0.181, 0.310)^{-1}\), \(\nu^P_{15-89} = \mathcal{N}(0.328, 0.447)^{-1}\), \(\nu^E_{0-14} = \mathcal{N}(0.306, 0.602 )^{-1}\), \(\nu^E_{15-89} = \mathcal{N}(0.480, 0.866)^{-1}\) | \(years^{-1}\) | Estimated based on the time from initial symptoms to starting treatment. | ETS |
| \(\phi\) | The reciprocal of the time to successful treatment completion | \(\phi_{0-14} = \mathcal{N}(0.606,0.237)^{-1}\), \(\phi_{15-69} = \mathcal{N}(0.645, 0.290)^{-1}\), \(\phi_{70-89} = \mathcal{N}(0.616, 0.265)^{-1}\) | \(years^{-1}\) | Estimated based on the time from starting treatment to treatment completion. | ETS |
| \(\mu\) | Rate of age-specific pulmonary/extra-pulmonary TB mortality | \(\mu_{0-14} = \mathcal{N}(0.0039, 0.018)\), \(\mu_{15-59} = \mathcal{N}(0.0226, 0.00787)\), \(\mu_{60-89} = \mathcal{N}(0.117, 0.0165)\) | \(years^{-1}\) | Estimated based on outcomes at 12 months where cause of death was known, including all-cause deaths in the denominator. | ETS |
| \(\zeta\) | Rate of loss to follow up | \(\zeta_{0-14} = \mathcal{N}(0.00976, 0.0179)\), \(\zeta_{15-59}= \mathcal{N}(0.0304, 0.00764)\), \(\zeta_{60-89} = \mathcal{N}(0.00614, 0.0159)\) | \(years^{-1}\) | Estimated based on outcomes at 12 months for TB cases | ETS |
| Parameters | Study Type | Setting | Year | Description | Source |
|---|---|---|---|---|---|
| \(\iota(t)\), \(\mu\), \(\nu^{P, E}\), \(\phi\), \(\rho\), \(\Upsilon\), \(\zeta\) | - | England | 2000-2015 | The Enhanced Tuberculosis Surveillance System (ETS) is a robust national data collection system that collects demographic and microbiological data on all notified cases in England. | ETS |
| \(\mu^{\text{all-cause}}(t)\), \(\omega(t)\) | - | England | - | The Office for National Statistics (ONS) compiles demographic, health, enconomic, and social data for the United Kingdom | ONS |
| \(C_{\text{eff}}\), \(C^{\text{hist}}_{\text{eff}}\) | Dynamic modelling study | England | Up to 1990 | Used a dynamic model of tuberculosis, robustly parameterised to the available evidence and including realistic population demographics to estimate the effective contact rate of TB over time until the 1990’s in the UK born white male population. | [118] |
| \(C\) | Contact survey | Europe - including the United Kingdom | 2005 | Conducted contact surveys, based on a contact diary, in multiple European countries. Contacts were stratified by age and type of contact. In the United Kingdom over a thousand people were surveyed. | [119] |
| \(\chi\) | Systematic review and meta-analysis | Global | Up to 2014 | A meta-analysis; conducted with the aim of determining whether BCG vaccination protects against tuberculosis infection as assessed by interferon \(\gamma\) release assays (IGRA) in children. Estimated both protection from initial latent infection and active TB disease. | [4] |
| \(\epsilon_H\), \(\epsilon_L\), \(\kappa\) | Systematic review | Global | Up to 2017 | Aimed to determine which dynamic TB model structure best captured the observed activation dynamics of TB. Identified 6 different commonly used model structures and compared them by fitting to activation data from the Netherlands and Australia. | [101] |
| \(\alpha_i^T\) | Clinical trial | England | 1950-1965 | Investigated the effectiveness of the BCG vaccine at preventing TB disease when given at what as then school-leaving age. Followed the cohort over 15 years and estimated the effectiveness of the BCG vaccine in 2.5 year intervals from vaccination. | [26] |
| \(\alpha_i^T\) | Population based case-control study | England | 2002-2014 | Recruited UK-born White subjects with TB and randomly sampled White community controls. Cox regression was used to adjusted for known confounders and the effectiveness of the BCG vaccine was estimated from 10 years after vaccination until 30 years after vaccinaton. | [29] |
| \(\delta\) | Systematic review and meta-analysis | Global | Up to 2012 | Reviewed prospective cohort studies of persons exposed to individuals with infectious TB. Only included studies that were published before the widespread treatment of latent TB. Aimed to estimate the reduction in re-infection for latent TB cases. | [115] |
| \(\beta_{\text{young-adult}}\), \(\gamma\), \(M_{\text{young-adult}}\), \(M\) | - | England | - | Where data, or literature, sources were not available assumed values were used based on expert opinion | Assumption |
8.5.2.1.1 Non-UK born pulmonary cases
Non-UK born pulmonary cases was estimated using the ETS for each age-group included in the model from 2000 until 2015. Prior to 2000, incidence in the non-UK born are unavailable and the relationship to transmission in UK-born cases is unknown. To account for this, importation of non-UK born cases in the model begins in 1960 and then is scaled up through to 2000. As the form of this relationship is unknown the following functional form was used to scale cases based on those observed in 2000,
\[\begin{equation} \text{Non UK-born cases (time = t)} = \left(\frac{\text{exp}\left(\frac{t - 1960}{\text{ln}(2) (-1) \iota_{\text{scale}}}\right) - 1}{\text{exp}\left(\frac{2000 - 1960}{\text{ln}(2) (-1) \iota_{\text{scale}}}\right) - 1}\right) \text{Non UK-born cases (t = 2000)} \tag{8.14} \end{equation}\]
This functional form was chosen as it is flexible enough to represent exponential growth, bounded growth and near linear growth depending on the choice of \(\iota_{\text{scale}}\). This allows the scale up of non-UK born cases to be fitted to the available data during the model fitting stage (Chapter 9). To incorperate the uncertainty in the number of observed non-UK born cases a normal distribution was used, with the standard deviation and mean determined using parameters from the observation model (Chapter 9).
8.5.2.1.2 Probability of transmission
The probability of transmission can be defined as the probability that a single contact between an infectious active TB case and a susceptible individual will lead to TB infection. The probability of transmission (\(\beta_a\)) can be redefined in terms of effective contacts (the number of contacts that are infected from each infected case; \(C_{\text{eff}}\)), historic effective contacts (\(C^{\text{hist}}_{\text{eff}}\)), actual average yearly total contacts (\(C_{\text{actual}}\)), the average period of time infectious (\(\frac{1}{\nu_{\text{avg}}^{P}}\)), and the average mortality rate (\(\mu_{\text{avg}}\)) as follows,
\[\begin{equation} \beta_a = \frac{(\nu_{\text{avg}}^{P} + \mu_{\text{avg}}) C^{\text{scaled}}_{\text{eff}}}{C_{\text{actual}}} \tag{8.15} \end{equation}\]
\[\begin{equation} C^{\text{scaled}}_{\text{eff}} = \begin{cases} C^{\text{hist}}_{\text{eff}} & \text{if } t < 1935, \\ C_{\text{eff}} + \left(C^{\text{hist}}_{\text{eff}} - C_{\text{eff}} \right) \left(\frac{t-1935}{C^{\text{half-life}}_{\text{eff}}}\right)^{1/2} & \text{if } 1935 \leq t \leq 1980, \\ C_{\text{eff}} & \text{if } t > 1980. \end{cases} \tag{8.16} \end{equation}\]
Vynnycky et al. found that the effective contact rate for TB was approximately 22 in 1900 and fell to approximately 1 in 1990.[118] Incidence rates have increased since the early 1980s and it is unclear what impact this has had on the effective contact rate. I have assumed that the effective contact rate is normally distributed with a mean of 1 and a standard deviation of 0.5. For the historic effective contact rate I have assumed a uniform distribution with a lower bound of the current effective contact rate and an upper bound of 20. I have also assumed that the historic contact rate declines over time, starting in 1935, reducing to the current effective contact rate in 1980. The speed of this decay is set by defining a decay parameter (\(C^{\text{half-life}}_{\text{eff}}\)). The prior for the decay parameter is assumed to be normally distributed with a mean of 5 years and a standard deviation of 5 (truncated to be greater than 0). This prior is based on the observed trend in notifications. Age stratification of \(\beta_a\) is explored by including modifiers for certain age-groups. The baseline scenario is that no modification is required, with variation explored for young adults (15-29; \(\beta_{\text{young adult}}\)) as a scenario. The prior for this modifier was assumed to be uniform, bounded by 0 and 10. The contact rate is estimated by averaging the total age-specific contact rates estimated from POLYMOD data (Section 8.5.2.1.5) on an annual basis.
8.5.2.1.3 Rate of recovery from active disease
The rate of recovery from active TB disease was estimated as the reciprocal of the time with active, untreated, disease from the ETS with UK born cases from 2000 until 2012. Cases with a period of time symptomatic that was less than 0 days were removed as these are likely to be spurious. Figure 8.3 indicates that the distribution of time to treatment differs between children and adults and by pulmonary/extra-pulmonary TB status. There was little evidence that time to treatment differed between adults and older adults. A normal distribution was used for each age group, truncated to be greater than 0 months. Prior to 1952, and the introduction of isoniazid, I have assumed that the time to recovery from active TB disease is 2 years, representing natural recovery or other removal from the infectious population. From 1952 to 1990 the time with active TB is assumed to decrease linearly.
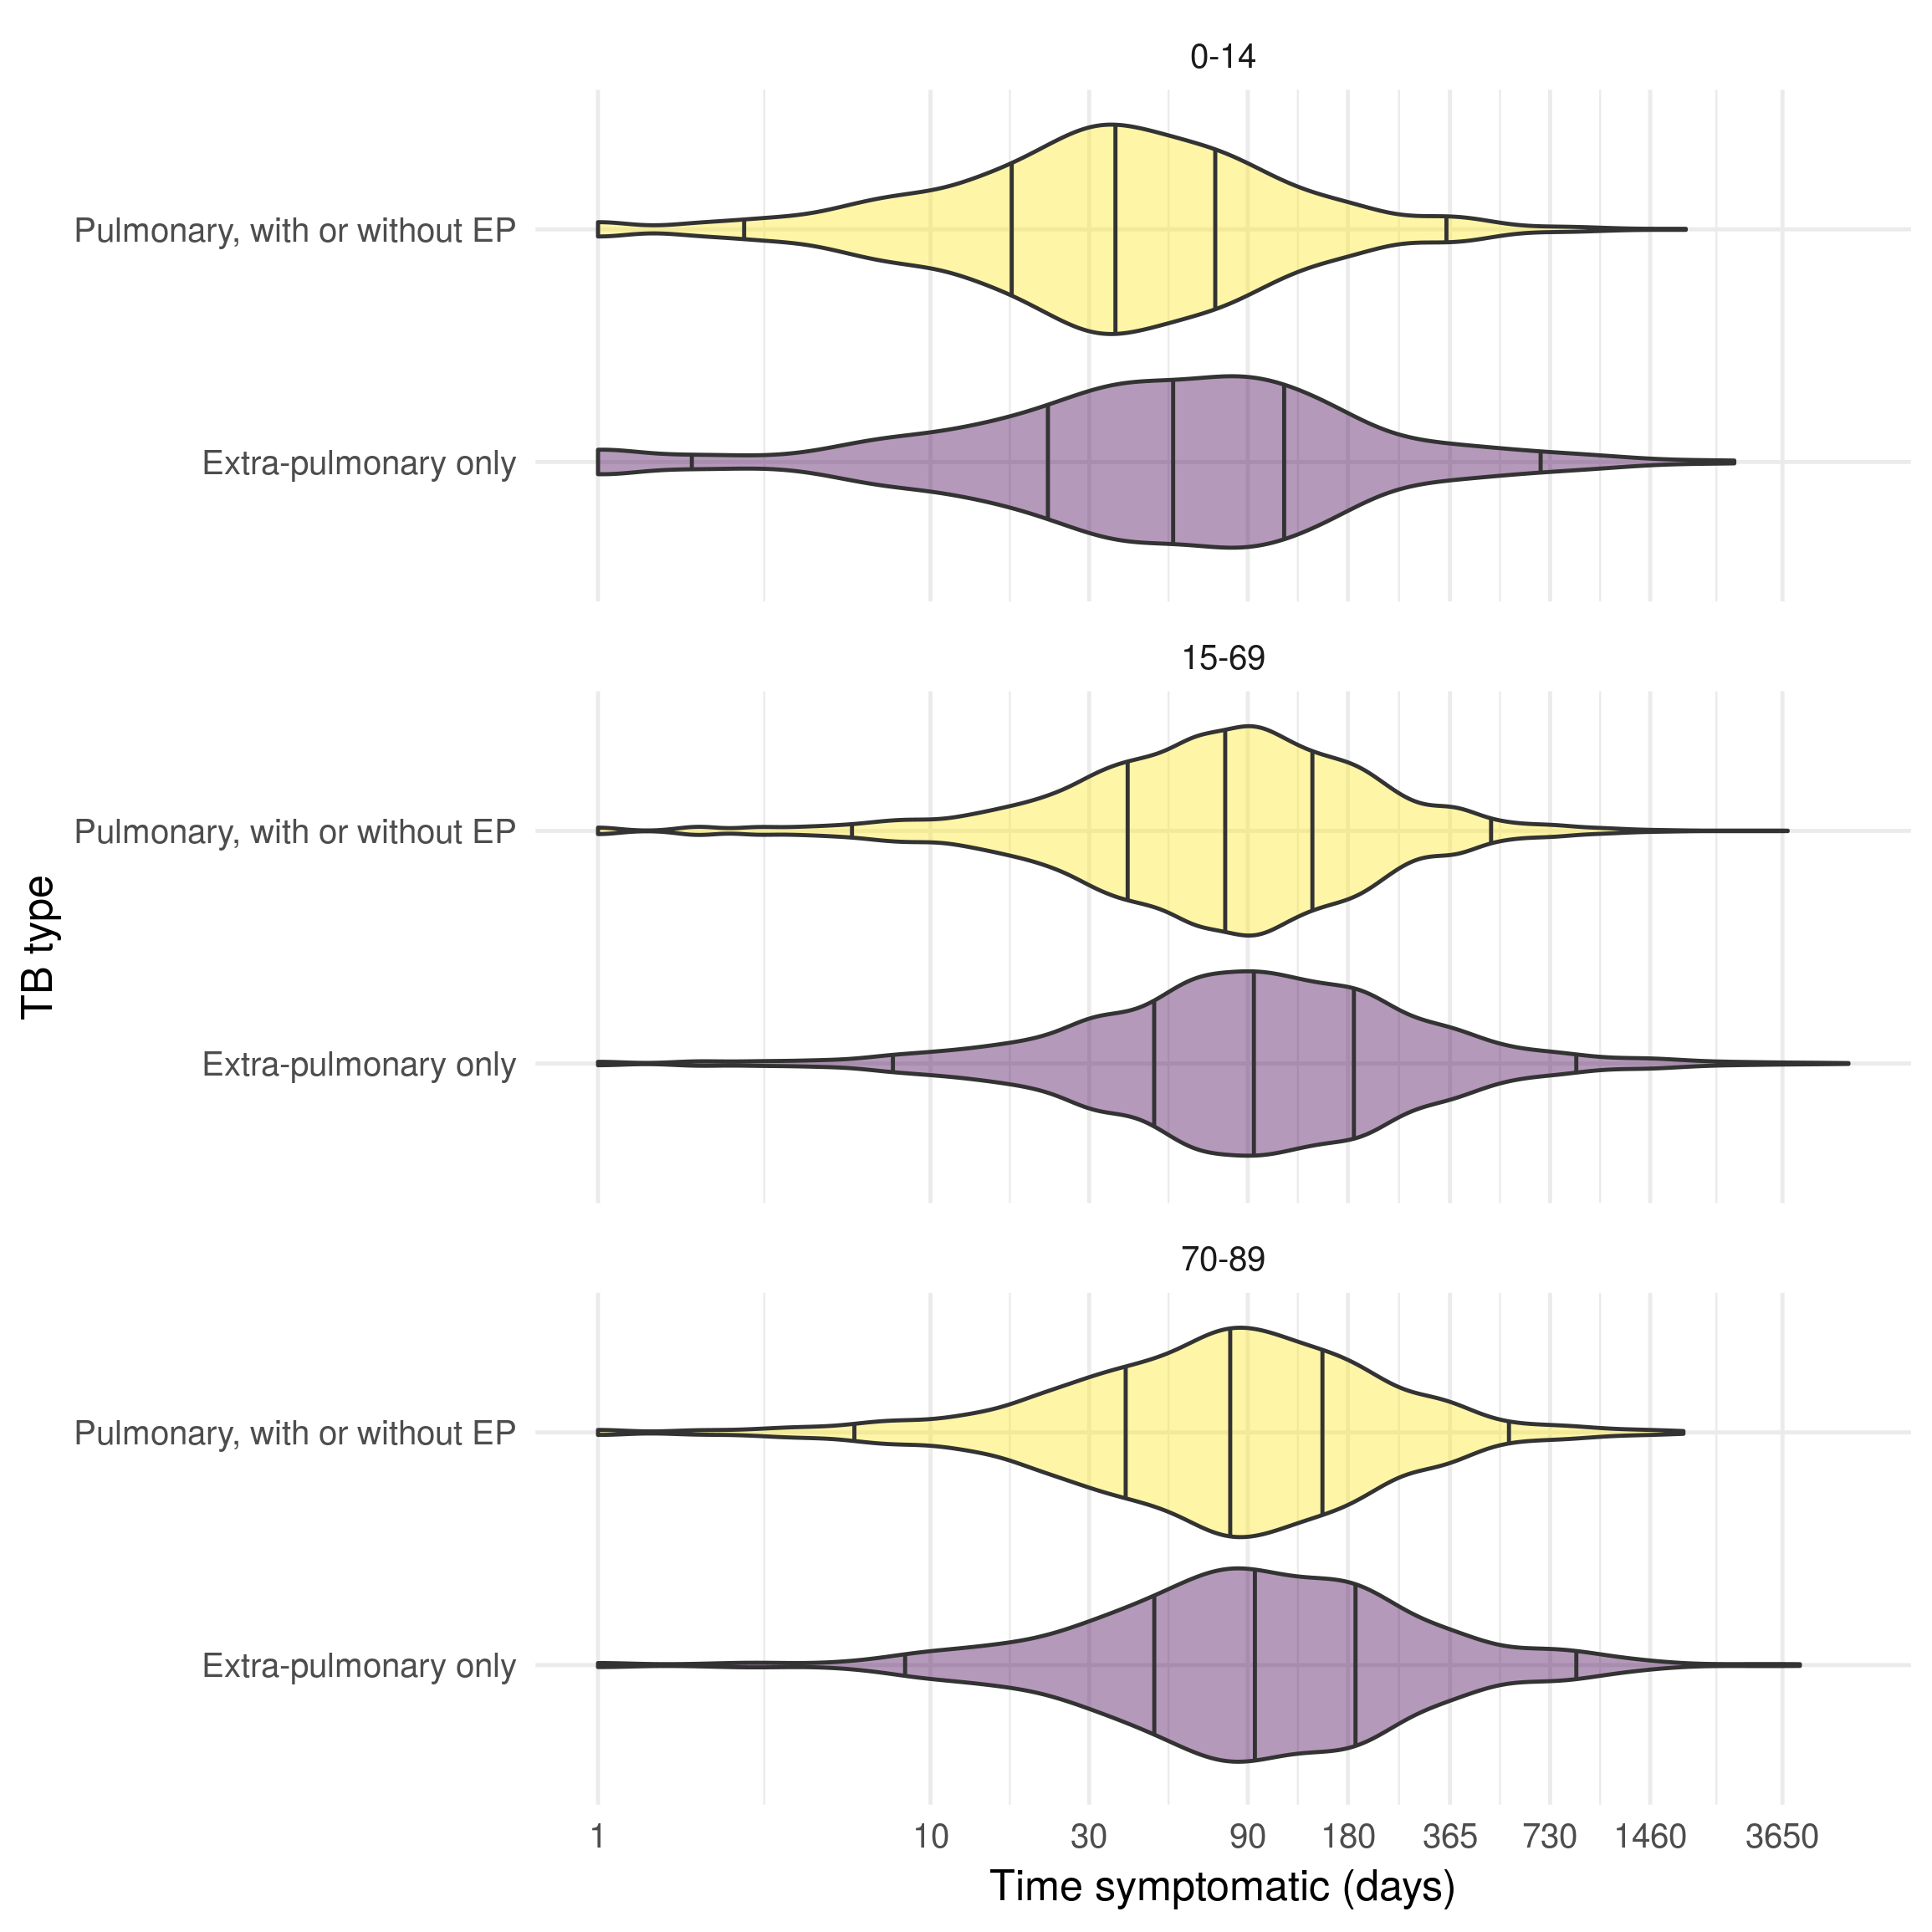
Figure 8.3: Distribution of time to treatment (days) from the date of reported symptom onset until the date started treatment for the UK born, stratified by age group and pulmonary/extra-pulmonary TB status in the ETS system for notifications between 2000 and 2012. Age is stratified into three groups; children (0-14), adults (15-69) older adults (70-89). The time from symptom onset to starting treatment is shorter for cases with pulmonary TB cases across age groups, with younger cases starting treatment more rapidly than older cases. Vertical lines indicate the 2.5%, 25%, 50%, 75%, and 97.5% quantiles.
8.5.2.1.4 Rate of successful treatment
The rate successful treatment was estimated as the reciprocal of the period of time on treatment using the ETS with UK born cases between 2000 and 2012. Cases with a treatment time less than 1 month were removed as TB treatment is standardised and should take at least several months. There was little evidence that time to treatment completion differed between pulmonary and extra-pulmonary TB cases but there was some evidence that older TB cases were more likely to be on treatment for longer than younger cases (Figure 8.4). A normal distribution was used for children, adults and older adults, with each truncated to be greater than 4 months. This truncation was introduced as a faster treatment time than this was considered implausible.
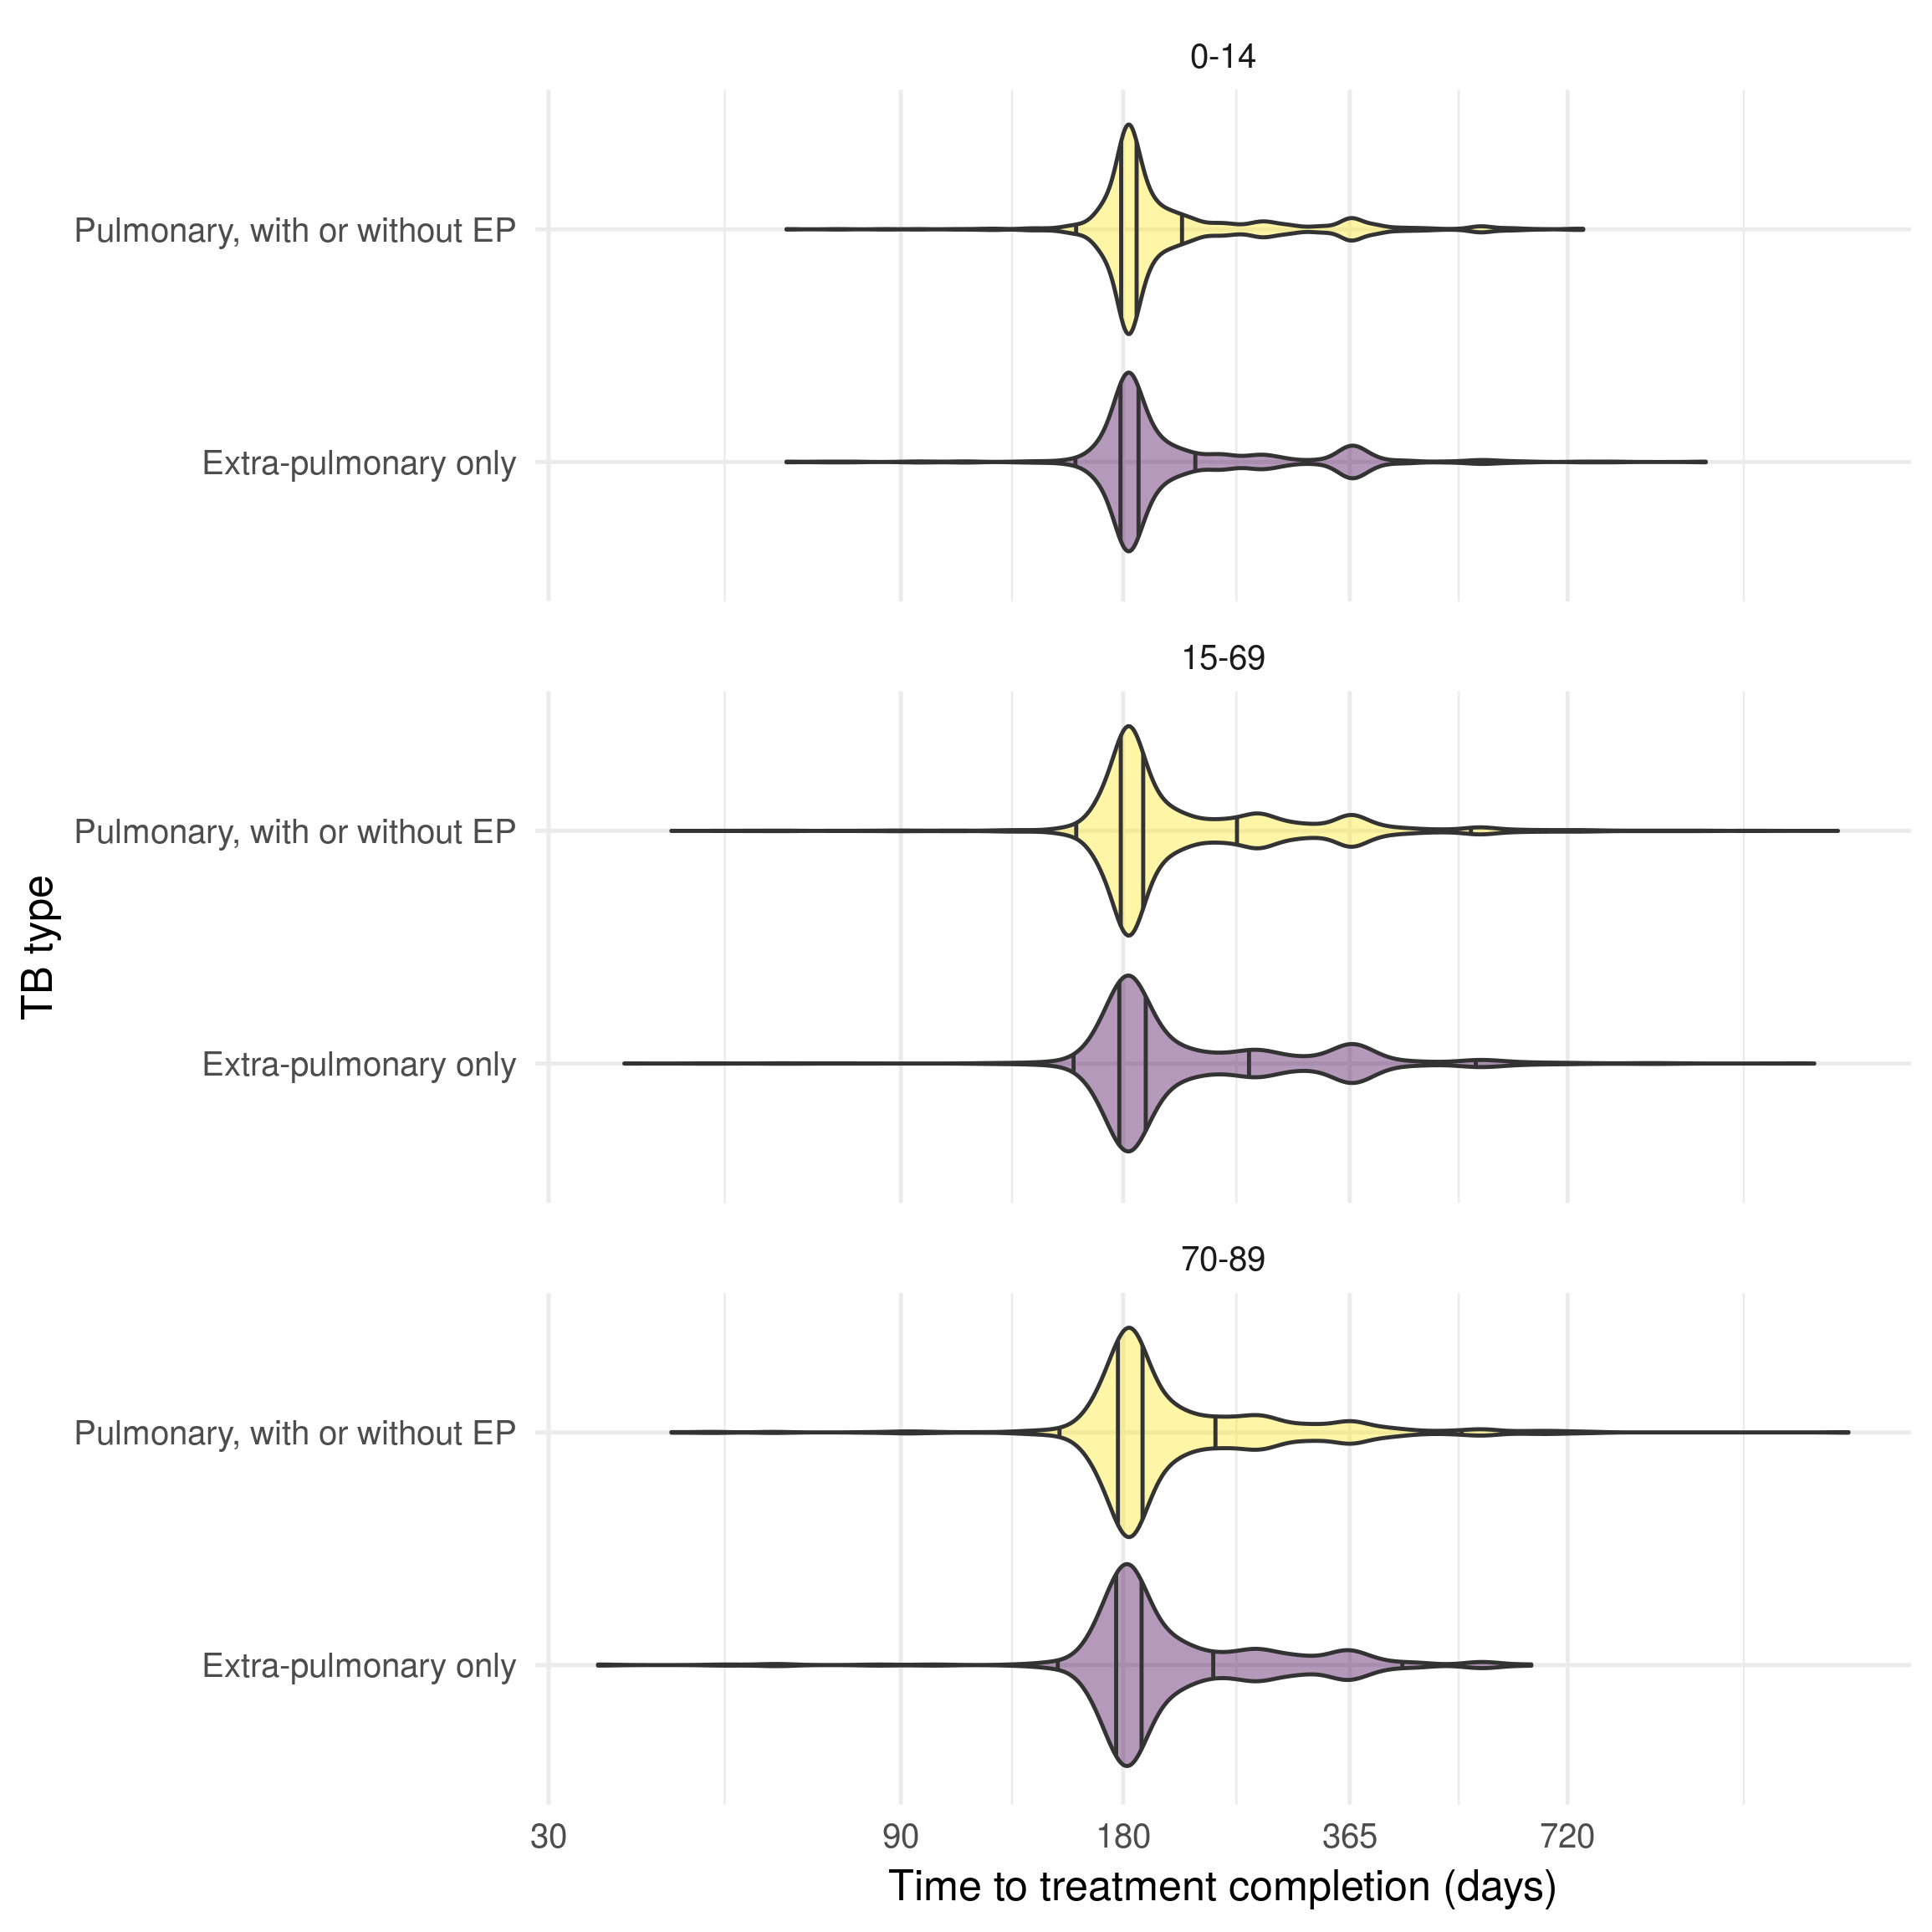
Figure 8.4: Distribution of time to treatment completion in the UK born successfully treated (days), stratified by age group and pulmonary/extra-pulmonary TB status in the ETS for notifications between 2000 and 2012. Age is stratified into three groups;children (0-14), adults (15-69) older adults (70-89). There is little evidence that the time to successful treatment differs between pulmonary and extra-pulmonary cases only but older cases appear to have a high likelihood of longer treatment times. Vertical lines indicate the 2.5%, 25%, 50%, 75%, and 97.5% quantiles.
8.5.2.1.5 Age-stratified contact matrix
The previously defined age-stratified contact matrix has 72 free parameters, assuming that the contact matrix is symmetric. Whilst these parameters could conceivably be fitted to the available age-stratified incidence data it is likely that doing so would result in over-fitting and potentially obscure other age related differences. An alternative is to specify the contact matrix using available data sources. This is commonly achieved using survey data on the number of self reported contacts between individuals.[119]
8.5.2.1.5.1 The POLYMOD contact survey
The POLYMOD survey,[119] which was conducted between May 2005 and September 2006, asked 7,290 participants across eight European countries (Belgium, Germany, Finland, Great Britain, Italy, Luxembourg, the Netherlands, and Poland) about the number of unique contacts on a randomly assigned day of the week. Survey participants were recruited to be broadly representative of the population in terms of geographical spread, age, and sex. Children and adolescents were deliberately over-sampled due to the important role they typically play in the transmission of infectious diseases. Contacts were defined as either physical (skin-to-skin contact) or as nonphysical (two-way conversation of 3 or more words in the presence of an individual but without physical contact). The age and gender of contacts was recorded as was the duration and location of the contact event. The locations were stratified into: home; school; work; transport; leisure; and other. In total 97,904 contacts were recorded, with both physical and nonphysical contacts showing large amounts of assortativity by age.
In the model presented here unstratified social (nonphysical) contacts are used to generate an age-stratified contact matrix. There are several reasons for this. Firstly, stratifying by home, school, work, transport or leisure contacts, whilst initially appealing as doing so may lead to insights as to the nature of the type of contacts required for TB transmission, may lead to over-fitting without a strong a priori hypothesis. In high and medium burden countries it has been shown that within household transmission is not a major driver of overall transmission.[109] Until recently it has been thought that household transmission plays a more dominated role in low burden settings, such as England, which would indicate that home contacts should be considered. However, it has recently been found that 7.7% (1849/24,060) of cases in England between 2010 and 2012 lived in a household with another case.[120] The same study estimated that overall only 3.9% of cases were due to recent household transmission, and there was no evidence that cases within households were more likely to transmit within the household than outside of it. There is little evidence to suggest that school, work, transport or leisure contacts are more likely to transmit TB in England than any other contact. The choice of contact type is disease dependent; for TB it is likely that closer contacts result in a greater likelihood of transmission.[109] Unfortunately the physical contacts recorded in the POLYMOD survey represent a poor proxy to closeness of contacts as physical contact can be a little as a handshake and because TB is a respiratory disease physical contact is not required. For this reason physical contacts have not been further evaluated. Instead, the uncertainty in age-dependent transmission rates has been explored by allowing for scenarios in which the transmission probability varies across age groups.
8.5.2.1.5.2 Generation of the symmetric contact matrix
As the POLYMOD contact data was collected using a survey there is likely to be measurement error and missing data for the number of contacts reported and the age that contacts were reported to be. Some participants also recorded contacts with an estimated age range rather than with a point estimate. In addition, as the survey had a relatively low sample size (1,011) in the UK, the estimated contact matrices contain considerable uncertainty. These considerations are often not considered in modelling studies but may introduce significant bias. Here the socialmixr R package29 is used to generate 1000 bootstrapped contact matrix samples using the following steps,
Missing or estimated ages are sampled from the appropriate ranges.
Using data on the participants of the POLYMOD study, and the contacts that they recorded, participants are randomly sampled (with replacement) and the mean number of contacts is then calculated from each age group (using 5 year age groups from 0-5 to 49, 50-69, and then 70+).
Each sampled contact matrix is then averaged to be symmetric, as logically contacts should be mutual. This can be represented mathematically as follows,
\[\begin{equation} C_{ij}N_i = C_{ji}N_j \tag{8.17} \end{equation}\]
Where \(N_i\) is the number of people in age group \(i\), \(N_j\) is the number of people in age group \(j\), \(C_{ij}\) is the number of contacts between members of group \(i\) with group \(j\) and \(C_{ji}\) is the number of contacts between members of group \(j\) with group \(i\). In the POLYMOD survey this relationship does not hold exactly due to random variation. A symmetric contact matrix (\(C^{\prime}_{ij}\)) can be derived by averaging the contacts between the \(i\) and \(j\) groups and the \(j\) and \(i\) groups for all age groups using the following equation,
\[\begin{equation} C^{\prime}_{ij} = \frac{C_{ij}N_i + C_{ji}N_j}{N_i + N_j} \tag{8.18} \end{equation}\]
The above equation requires data on the population in which the survey was undertaken in order to create a symmetric contact matrix. Here we use the 2005 population of the UK as it is most representative of the POLYMOD study population.
This results in 1000 bootstrapped symmetric contact matrices based on the reported social contacts in the POLYMOD survey for the UK. In order to be used in the model the mean and standard deviation are calculated for the number of contacts between each age group, the data is also scaled to represent non-unique yearly contacts by multiplying by \(365.25\). Contacts are then modelled noisily using a normal distribution around the mean number of contacts with the standard deviation as calculated above.
The final mean contact matrix is visualised in Figure 8.5, along with the normalised standard deviation. It is clear that the POLYMOD mixing is highly assortative with the majority of contacts occurring between those close to the same age.[119] The highest number of contacts were between children and young adults (between 5 and 20), with the number of within age groups contacts reducing as age increased. There was some outside age group mixing for all age groups with a large amount of mixing between children and middle aged adults (i.e parents and children). There was some uncertainty for all contact rates with the minimum normalised standard deviation being 10% of mean contact rates. Contact rates between older adults and children were highly uncertain and contact rates for older adults were also generally more uncertain.
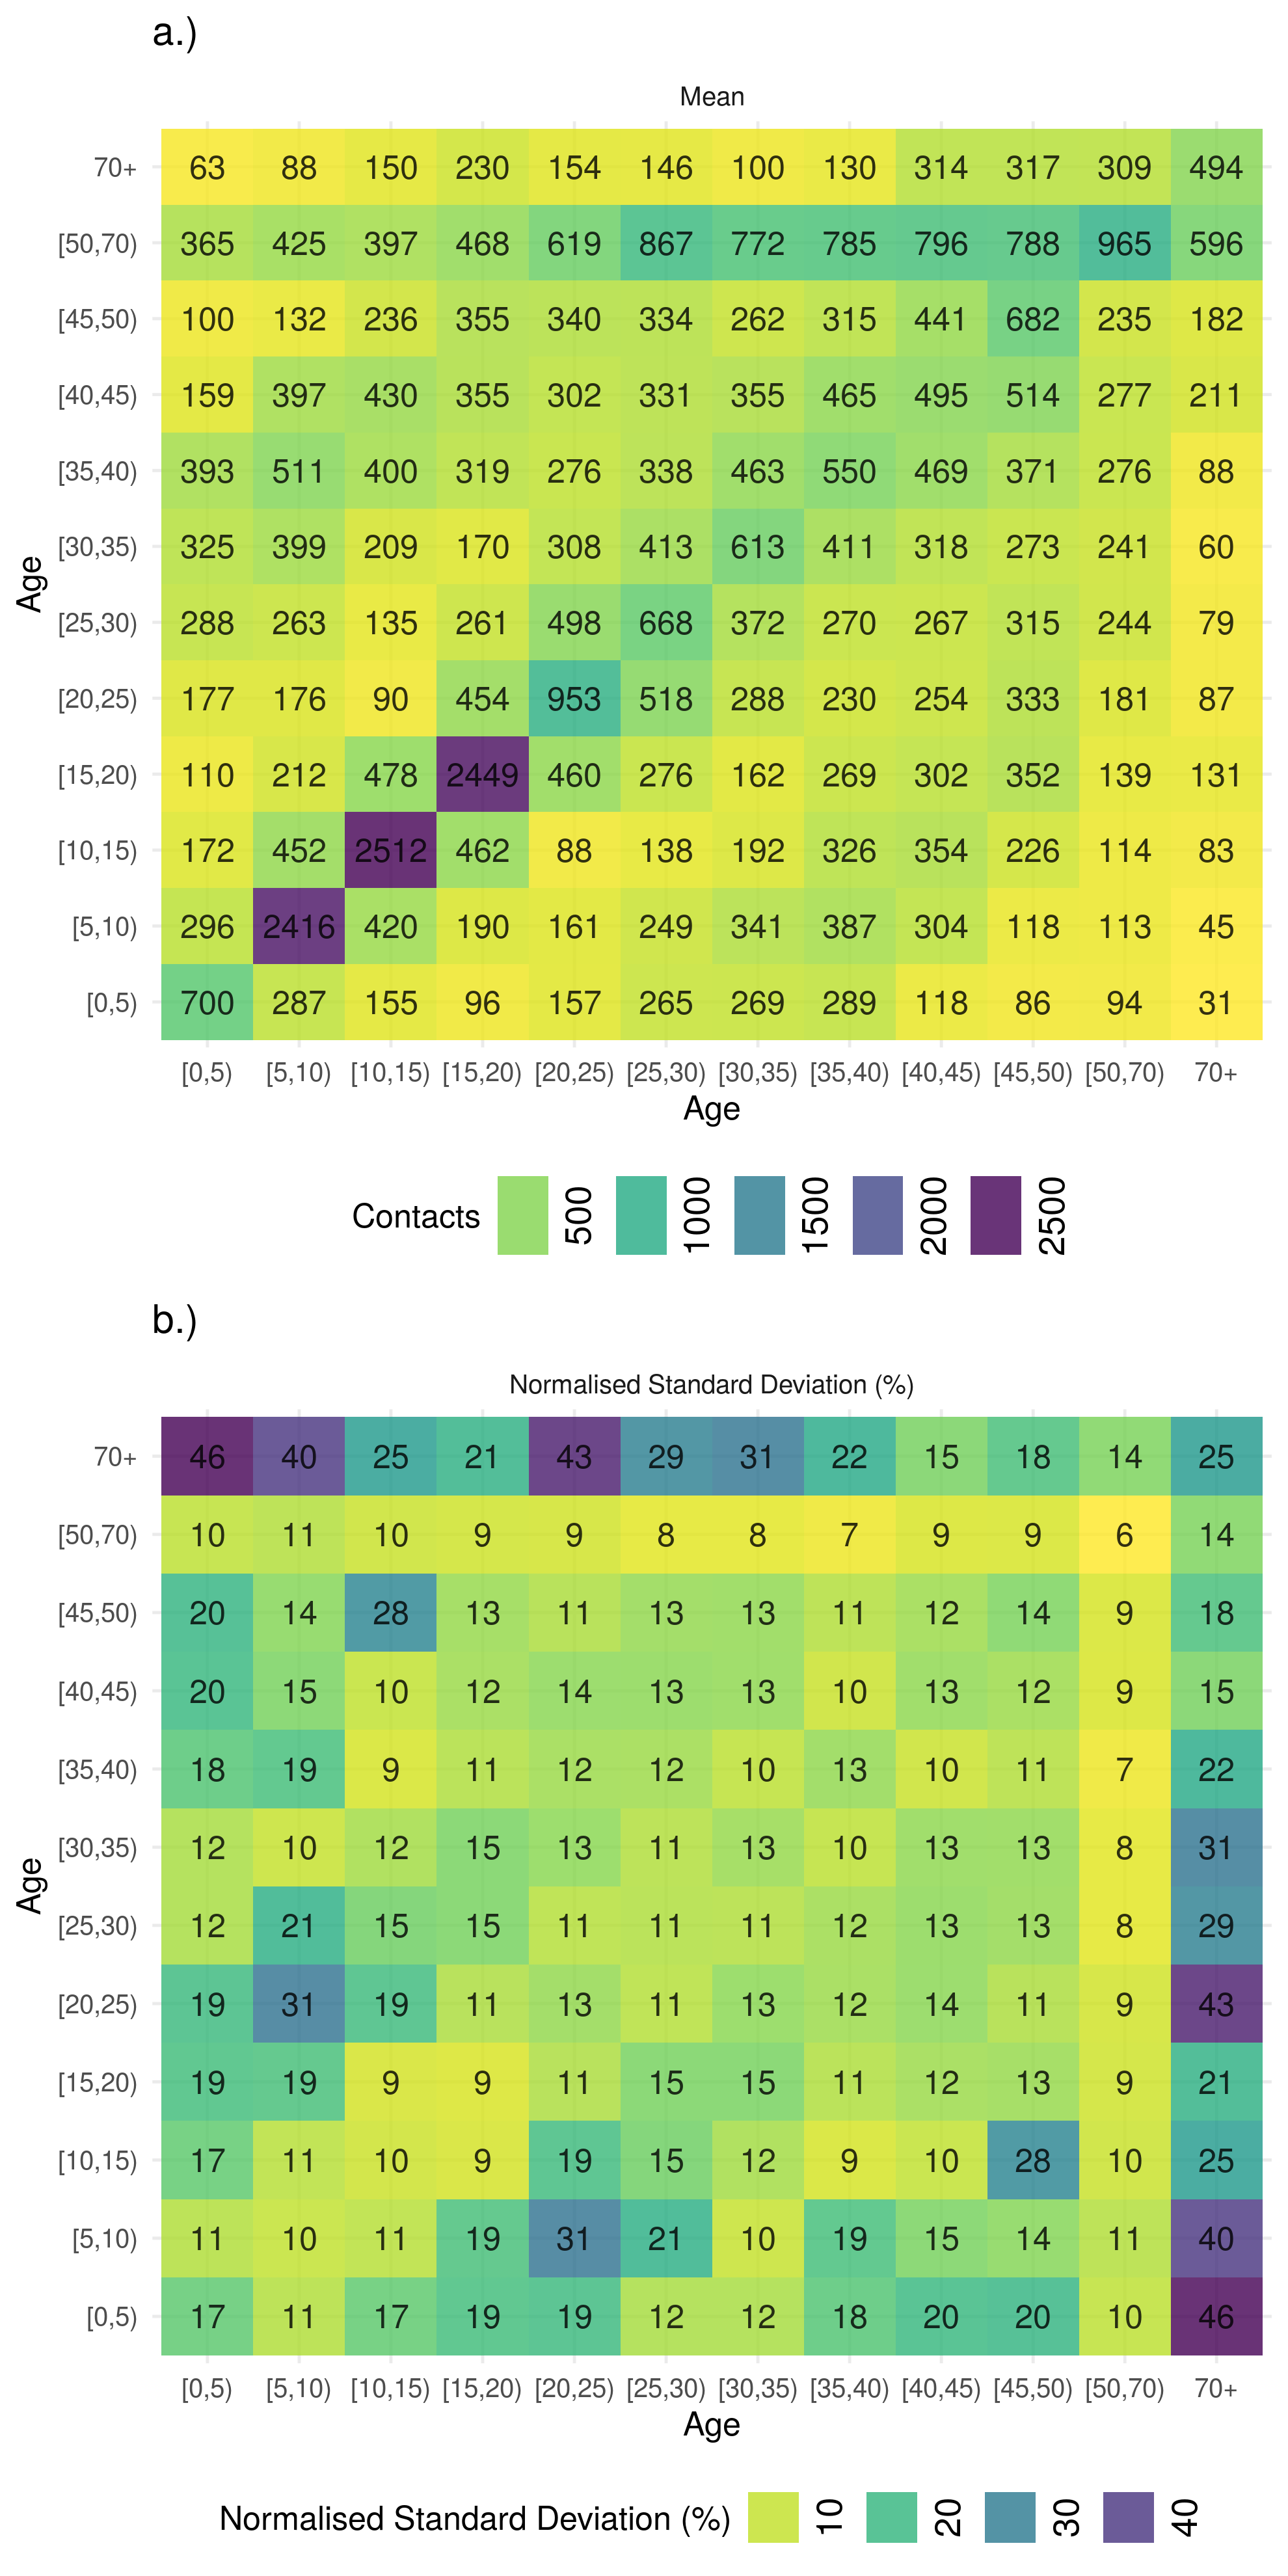
Figure 8.5: a.) Mean contacts (non-unique social contacts per year) and the b.) normalised standard deviation (%) of 1000 boostrapped samples of social contacts from the POLYMOD social contact survey using 5 year age groups up 49 years old and then a single group for 50-69 year olds. Mixing is highly assortative by age with children and young adults representing the majority of contacts. There is also evidence of mixing between children and middle age adults with older children mixing with progressivly older adults. Contact rates in older adults are highly uncertain, with the most uncertainty in mixing between older adults and young children.
8.5.2.2 Vaccination model parameters
An overview of the vacination model parameters can be found in Table 8.1 for parameters that impact the natural history of TB, Table 8.4 for parameters that impact the population level distribution of BCG vaccination, and Table 8.2 for an overview of the sources used to generate prior distributions. More detail is given in the following section.
8.5.2.2.1 Effectiveness of the BCG vaccine at preventing active TB
The effectiveness of the BCG vaccine is usually estimated using its effectiveness at reducing the incidence of active TB cases in a susceptible population. In the model outlined in this chapter the action of the BCG vaccine has been split into its main effect of reducing the rate of latent TB cases developing active disease and its secondary effect of reducing the likelihood of initial infection. There are few estimates of the effectiveness of the BCG vaccine at preventing active TB in cases that are already latently infected and where these estimates do exist they are not stratified by time since vaccination, or age at vaccination.[4] The overall effectiveness (\(\alpha^T_a\)) of the BCG vaccine can be estimated from the combined effectiveness at preventing initial infection (\(\chi^v_a\)) and the effectiveness at preventing activation in latently infected individuals (\(\alpha^v_a\)) using the following equation,
\[\begin{equation} \alpha^T_a = \chi^v_a + (1 - \chi^v_a) \alpha^v_a \tag{8.19} \end{equation}\]
The effectiveness of the BCG vaccine at preventing active TB in those latently infected can then be found via rearrangement as follows,
\[\begin{equation} \alpha^v_a = \frac{\alpha^T_a - \chi^v_a}{1 - \chi^v_a} \tag{8.20} \end{equation}\]
There is strong evidence that the overall effectiveness of the BCG vaccine reduces over time.[28,29] For this reason the effectiveness of the BCG vaccination overall (\(\alpha^T_a\)) has been stratified by the time since vaccination (by 5 year age groups). This step-wise approach has been chosen as the majority of studies report estimates for these groups and the precise functional form of the reduction in protection is unknown. For 0-4, and 5-9, years since vaccination estimates of the effectiveness of the BCG vaccine were extracted from the MRC trial.[26] Using published data, Poisson regression was used to estimate rate ratios and 95% confidence intervals. For 10-29 years after vaccination rate ratio estimates from a more recent case control cohort study in the UK born vaccinated at school-age have been used.[29] Table 8.3 details the estimated effectiveness for each five yearly band after initial vaccination from these data sources. I have assumed that the BCG vaccine is equally effective regardless of the age at vaccination as there is no evidence that protection reduces when given to older age groups in England.
| Time since vaccination (years) | Effectiveness (%) |
|---|---|
| 0-4 | 84 (76, 90) |
| 5-9 | 69 (51, 81) |
| 10-14 | 56 (33, 72) |
| 15-19 | 57 (36, 71) |
| 20-24 | 25 (-10, 48) |
| 25-29 | 21 (-39, 55) |
Using the literature derived estimates for the Risk Ratio (RR) of the BCG vaccine at different periods after vaccination, the log normal approximation for the distribution of Risk Ratios, and the relationship between vaccination effectiveness and the Risk Ratio (Effectiveness = 1 - Risk Ratio) I derived a prior distribution - which can be sampled from - for the overall effectiveness of the BCG vaccine (\(\alpha^T_a\)). This can be summarised by the following equation,
\[\begin{equation} \alpha^T_a \sim 1 - e^{\left(\mathcal{N}(\text{ln}(RR_{t_v}), SE_{t_v})\right)} \tag{8.21} \end{equation}\]
Where \(RR_{t_v}\) is logged risk ratio and the \(SE_{t_v}\) is the standard error of the logged Risk Ratio with both being dependent on the time since vaccination (\(t_v\)). The transformed values used as the prior distribution are detailed in Table 8.1.
8.5.2.2.2 Effectiveness of the BCG vaccine at preventing initial infection
Roy et al. published a meta-analysis that estimated the effectiveness of the BCG vaccine at preventing initial infection in children.[4] This has been used as the primary source for this parameter, with the assumption being made that the effectiveness is the same in adults as it is in children. This is reasonable to assume as there is little evidence that the overall effectiveness of the BCG vaccines reduces with the age it is given in England. Unfortunately the meta-analysis by Roy et al. did not include an estimate of the effectiveness of the BCG vaccine at preventing initial TB infection stratified by time since vaccination. This is problematic as there is a large amount of evidence that the overall effectiveness of the BCG vaccine wanes with time,[28,29] and if the protection from initial infection does not also reduce over time then as overall effectiveness decreases the contribution from the prevention of initial infection will increase. For this reason I have assumed that the protection from initial infection (\(\chi_j\)) reduces over time with the same functional form as for the overall effectiveness of BCG vaccination (\(\alpha^T_j\)). This relation can be formalised using the following equation,
\[\begin{equation} \chi^v_j = \frac{\alpha^T_j\chi^v_i}{\alpha^T_i} \tag{8.22} \end{equation}\]
Where \(i\) is the age at vaccination and \(j\) is any subsequent age group.
8.5.2.3 Demographic model parameters
The demographic model parameters are outlined in Table 8.4, additional details are given in the following section. Table 8.2 contains details of the sources used to parameterise the demographic model, again more detail is given in the following section for complex parameters.
| Parameter | Description | Distribution | Units | Method | Type |
|---|---|---|---|---|---|
| \(\omega(t)\) | Time varying births |
|
|
The dataset contains the estimated number of births from 1929-2015 in England. From 2016 onwards the numbers of births are projections as published by ONS. | ONS |
| \(\gamma\) | BCG vaccination coverage | \(\gamma_{i} = \mathcal{N}(0.75, 0.05)\) Where \(i\) is the age group vaccinated. | Proportion | England has a robust national health service and an established system for providing BCG vaccination. | Assumption |
| \(\theta\) | Rate of ageing |
|
\(years^{-1}\) | Defined as the reciprocal of the width of the modelled age groups. | Model defined |
| \(\mu^{\text{all-cause}}(t)\) | Time varying all-cause age-specific mortality rate |
|
\(years^{-1}\) | Age specific mortality averaged across age group from 1981-2015. From 2016 onwards, and prior to 1981, mortality rates are modelled using a exponential model fit to data from 1981 until 2015. | ONS |
8.5.2.3.1 Age-stratified population estimates
Age-stratified and UK birth stratified population estimates for England were estimated using the LFS (Section 4.5). Figure 8.6 indicates that the age distribution of the UK born population changed over the study period (2000 to 2015) with an increase in those in late middle age (45-49 years old) and older and a decrease in those in early middle age. The proportion of young adults and young children also increased. This may have impacted TB incidence as young adults are thought to be responsible for the majority of transmission. Data from the 1931 census was also used to estimate the population of England in 1931 stratified into the modelled age groups.
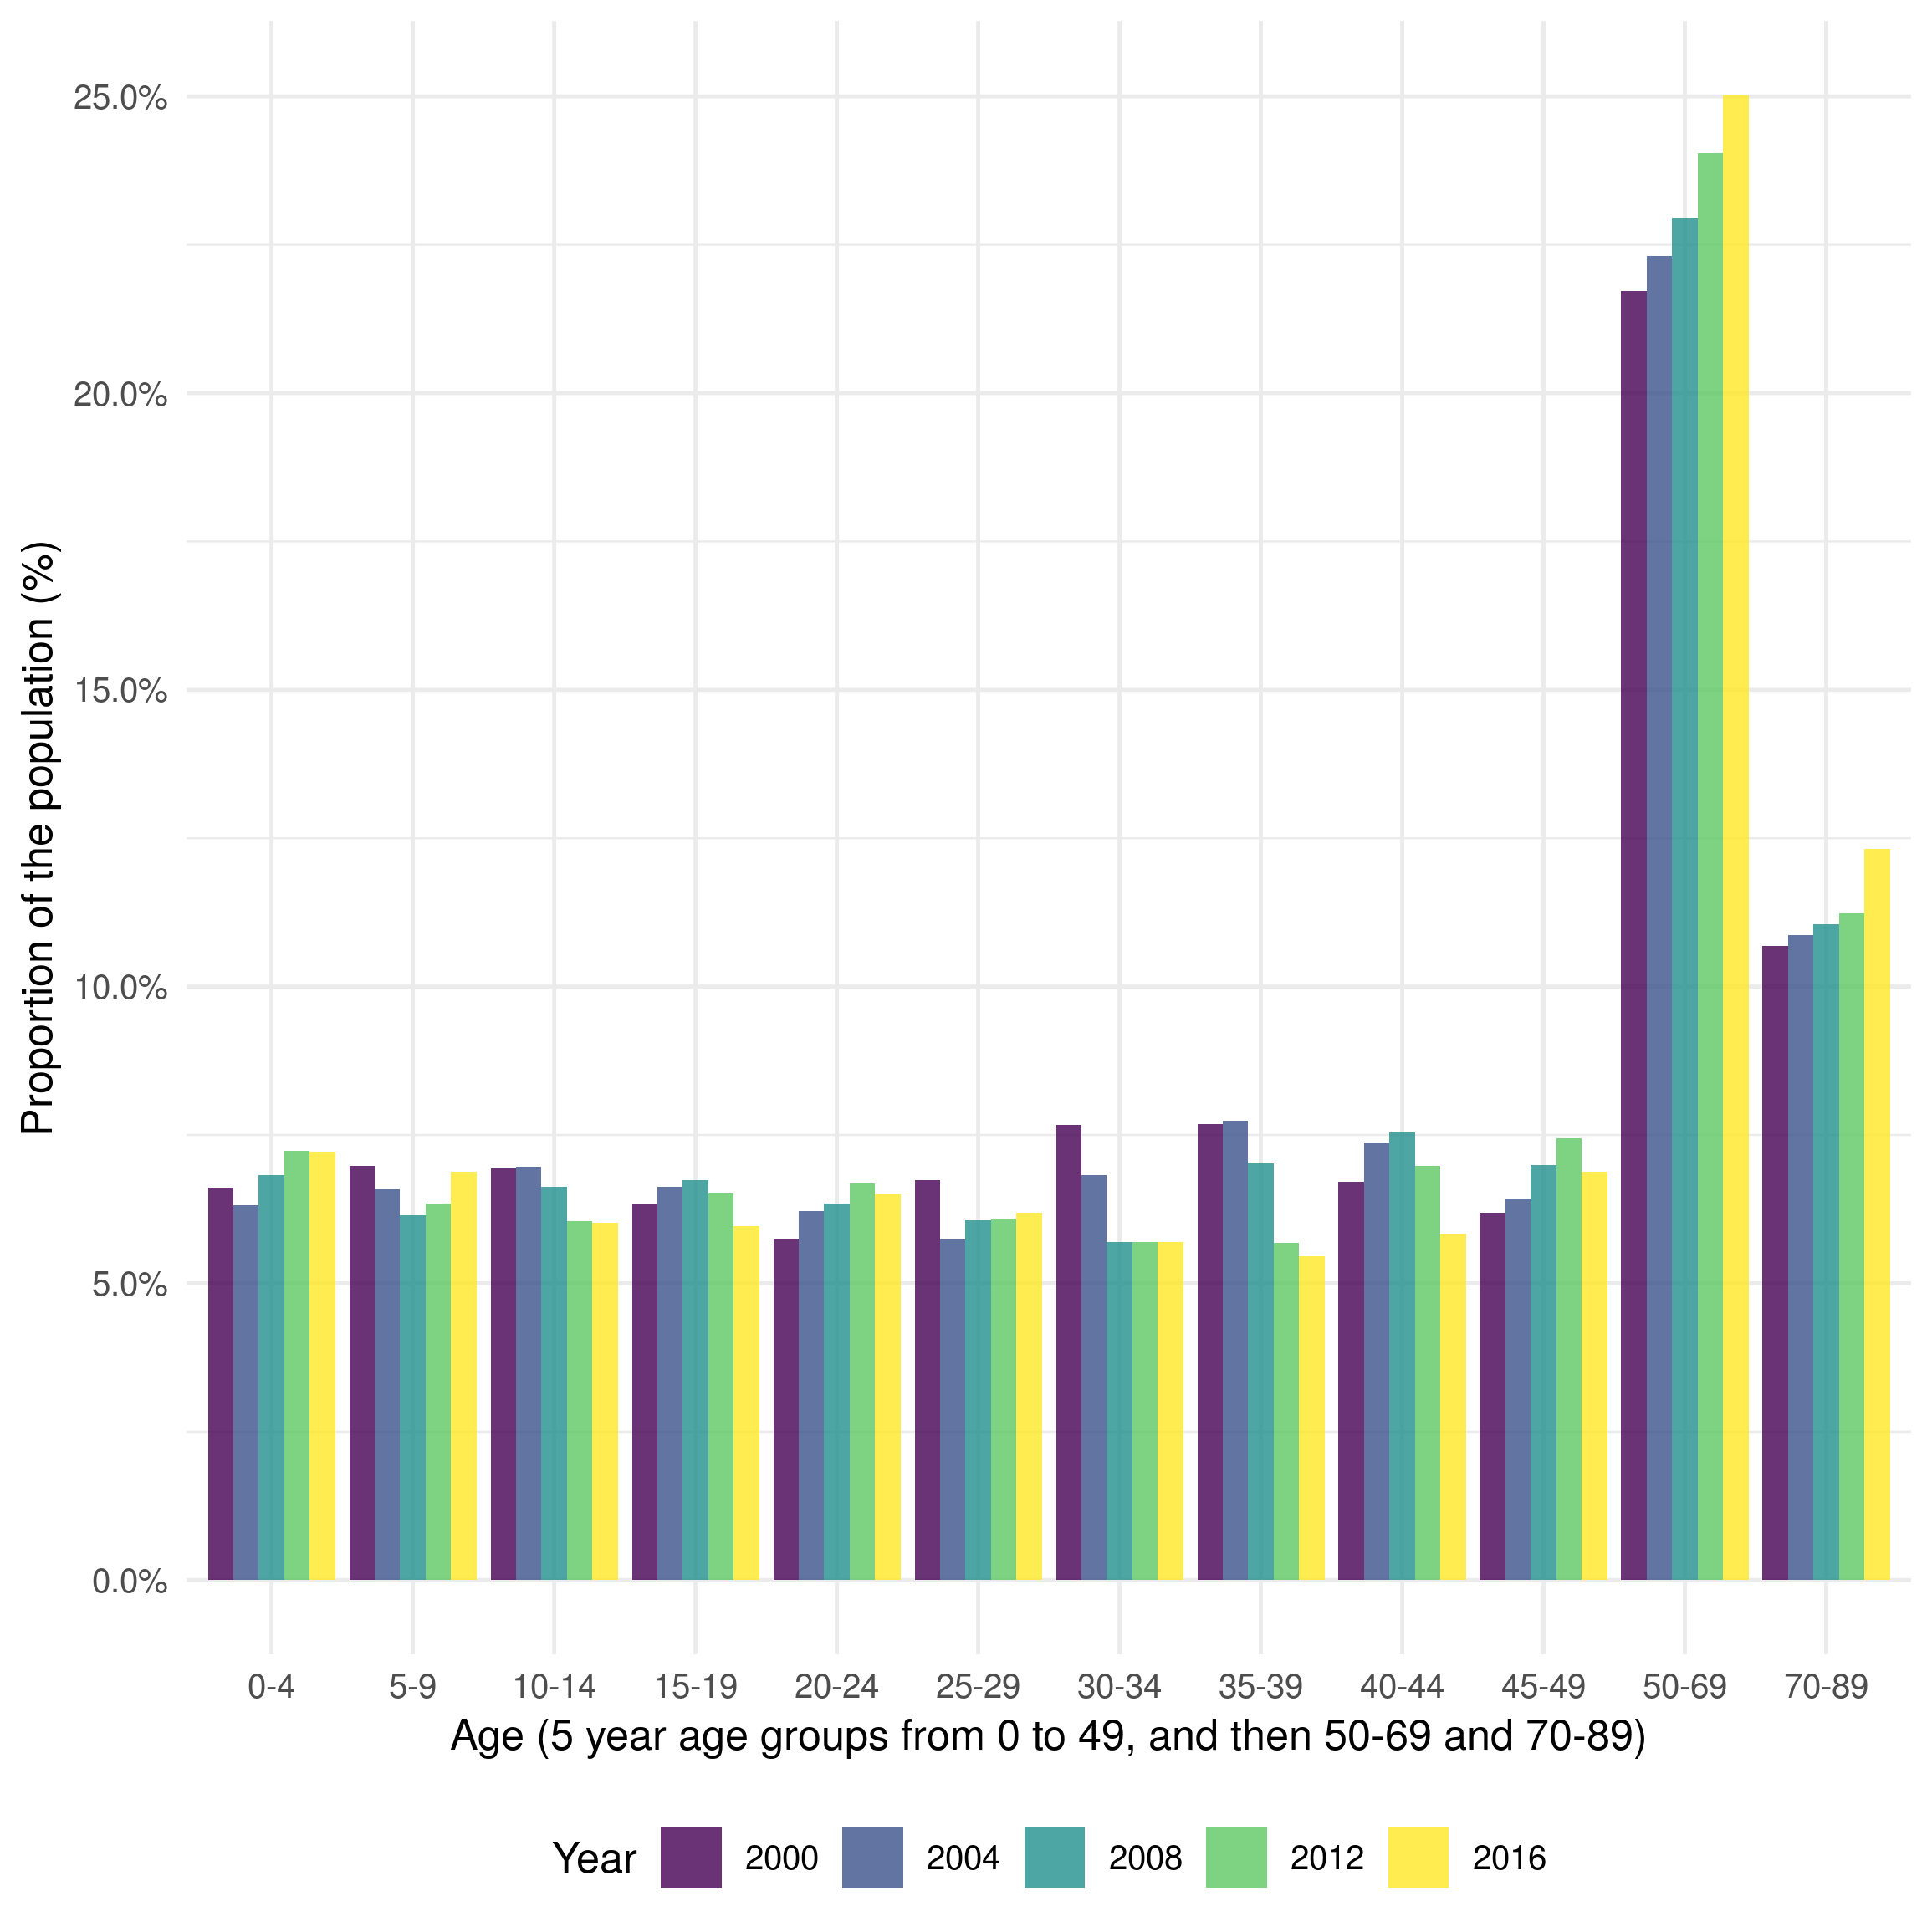
Figure 8.6: Distribution of the UK born population of England in 2000, 2004, 2008, and 2012. Age is grouped into 5 year age groups from 0 to 49, from 50-69, and from 70 to 89. Those aged 90+ are excluded due to low quality data. The age groups used here represent those used in the model. The figure indicates that the population has skewed older overall over the last two decades, although the proportion of young children has increased in the last 10 years.
8.5.2.3.2 Observed and projected births
The number of births is incorporated into the demographic model as a time varying, noisy, parameter (\(\omega(t)\)). It is parameterised from the data published by the Office for National Statistics (ONS), with the available data covering all years modelled. The ONS publishes the recorded number of births in England each year starting from 1929 through to 2015, with projections avaiable through to 2101 (Figure 8.7). As there is some uncertainty as to the number of births in each year I included normally distributed noise with a standard deviation of 5% of annual births.
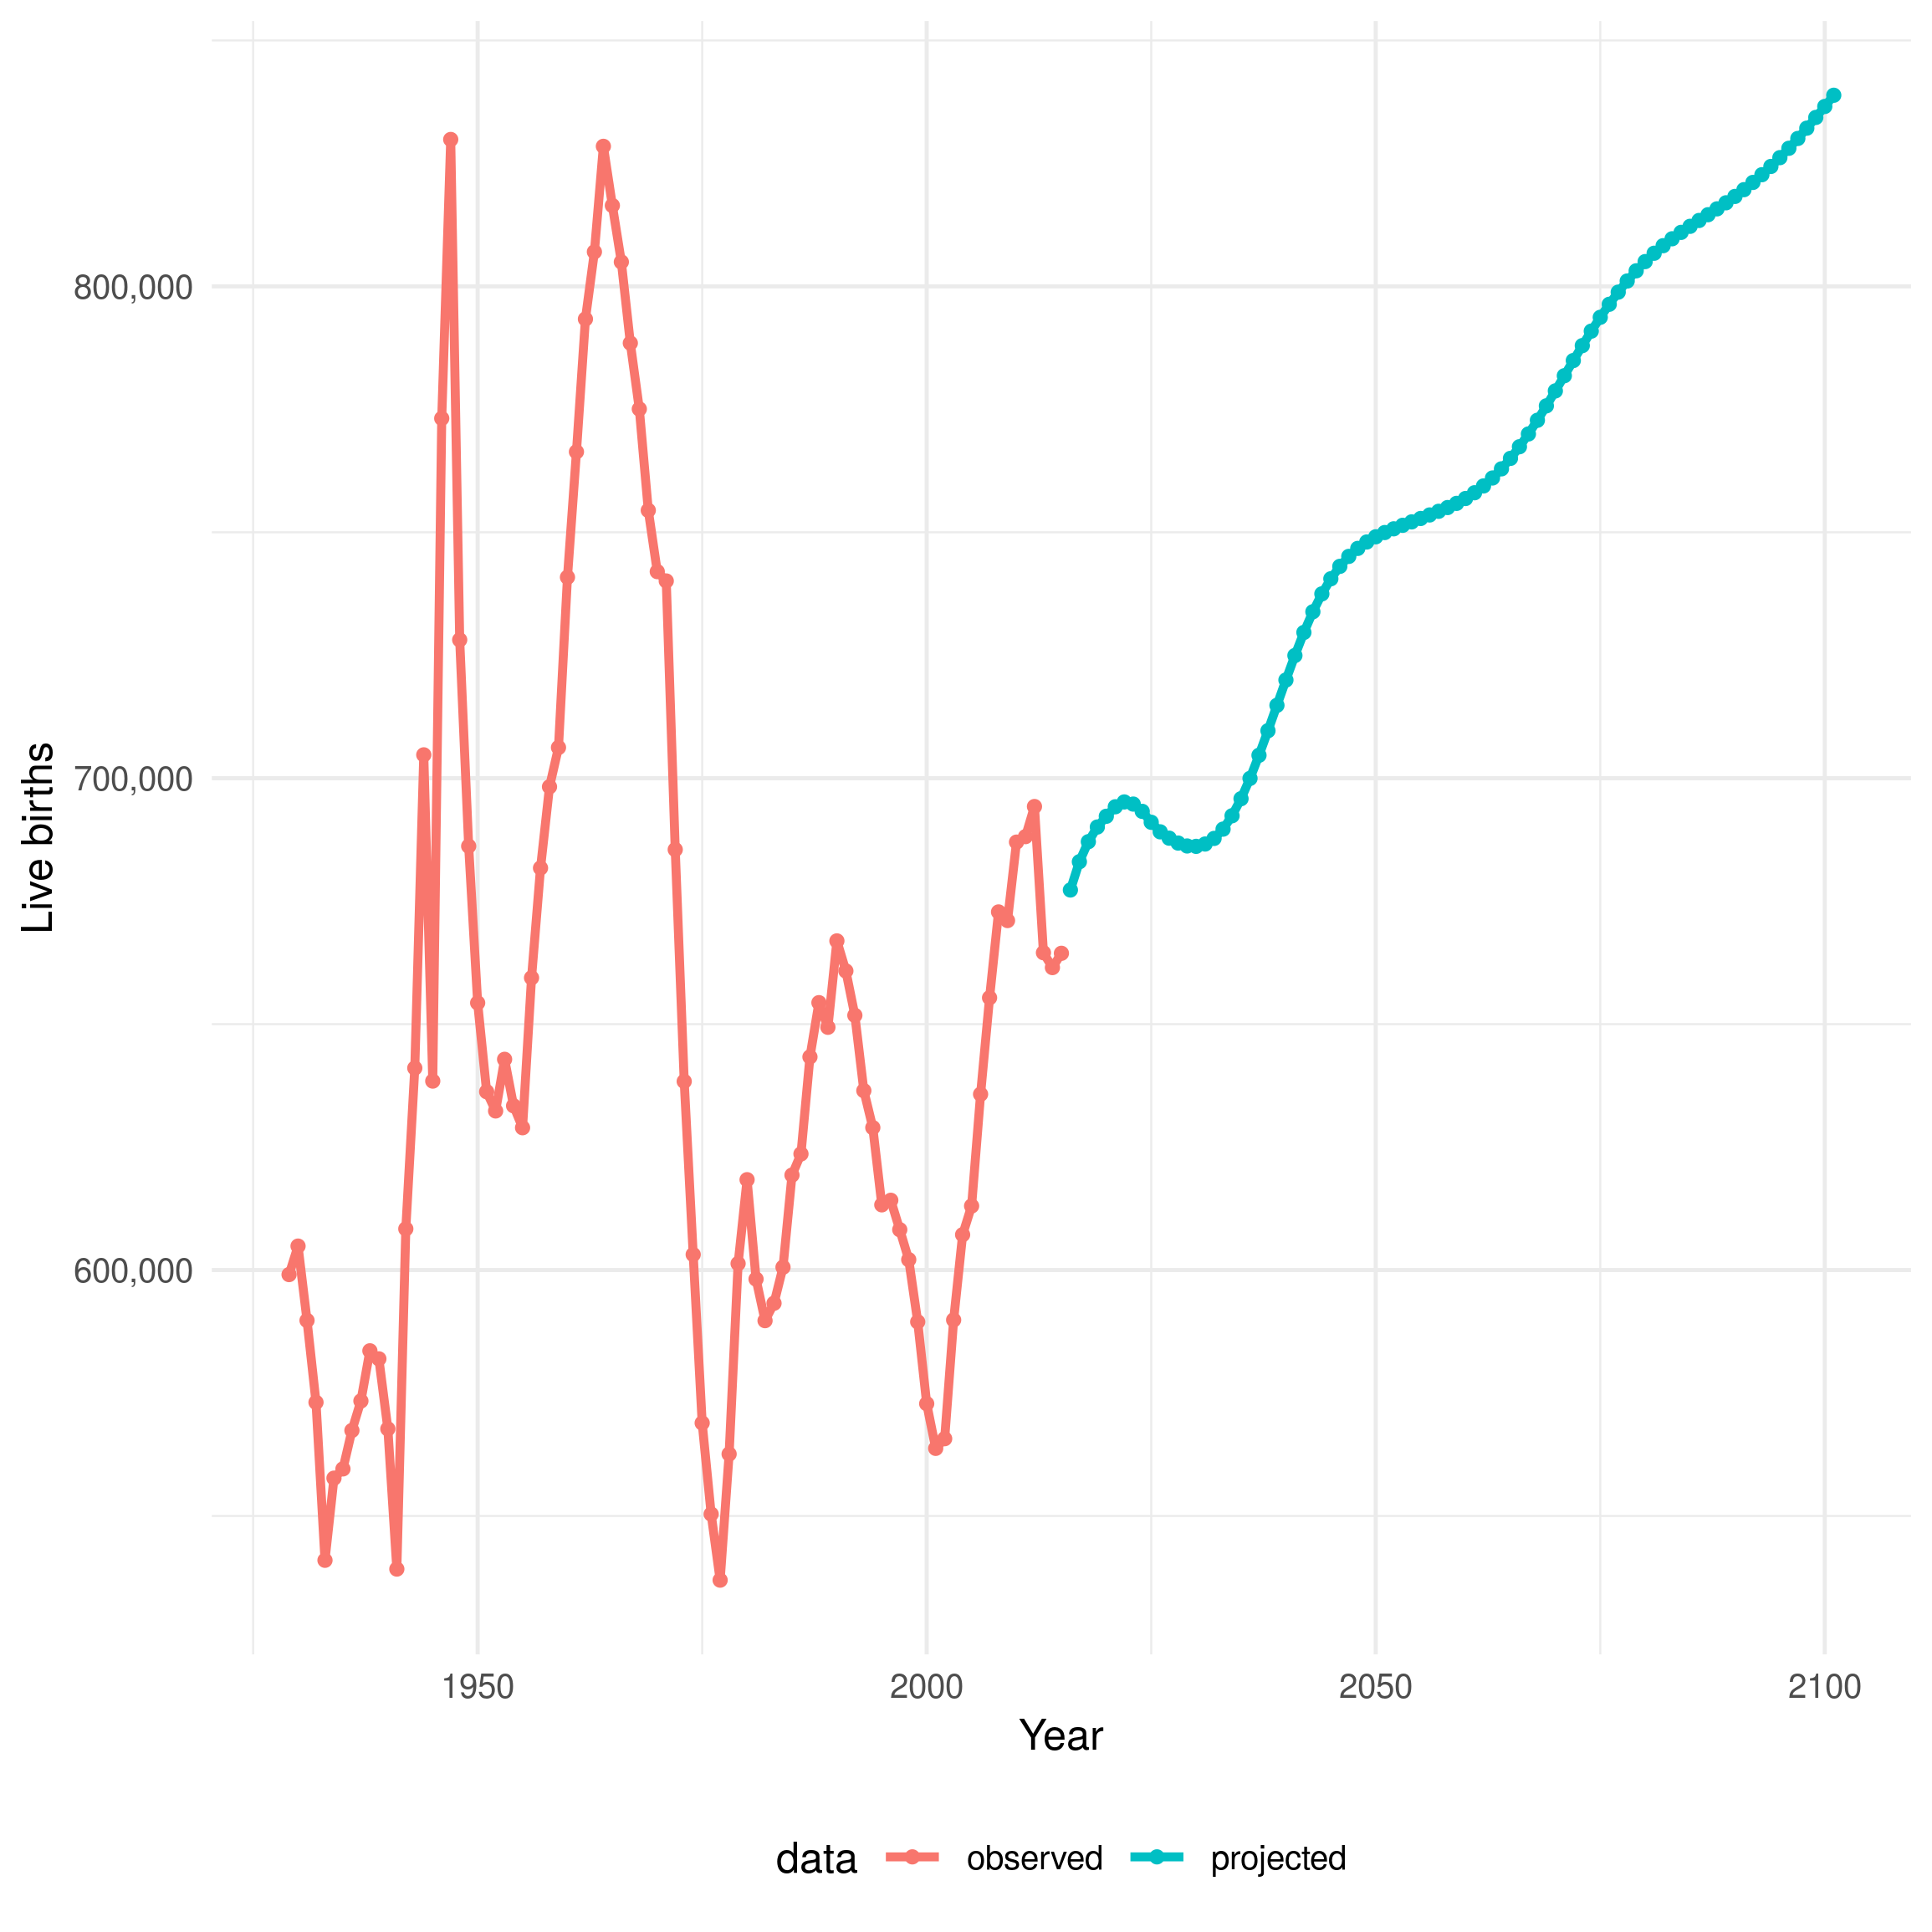
Figure 8.7: Estimated and projected live births in England from 1929 until 2101. The red line indicates estimated data and the blue line indicates projected data. Data is sourced from the ONS.
8.5.2.3.3 Age-specific mortality rates
The time varying, age-specific, noisy, all-cause mortality rates (\(\mu^{\text{all-cause}}_a(t)\)) included in the demographic model are sourced from Office for National Statistics (ONS) estimates from 1981 until 2015. For years outside of the available data I forecast rates using an age-stratified exponential model (Figure 8.8). This model was used as it constrains mortality rates above zero and decreases yearly changes in mortality rates over time. To model the uncertainty in the estimate of the annual number of deaths a normally distributed noise term was introduced with a standard deviation of 5%. In order to calculate the all-cause dynamic mortality rate (\(\mu_a(t)\)), excluding deaths from, or related to, TB the following equation was used,
\[\begin{equation} \mu_a(t) = \mu^{all-cause}_a(t) - \left(\frac{\mu^P_a(P_a + T_{Pa}) + \mu^E_a(E_a + T_{Ea})}{N_a}\right) \tag{8.23} \end{equation}\]
Where \(\mu_a(t)\) is constrained to be greater than or equal to zero, \(\mu^{P}_a\) and \(\mu^E_a\) are the age stratified deaths rates in pulmonary (\(P_a\)) and extra-pulmonary TB cases (\(E_a\)), and \(N_a\) is the age stratified population.
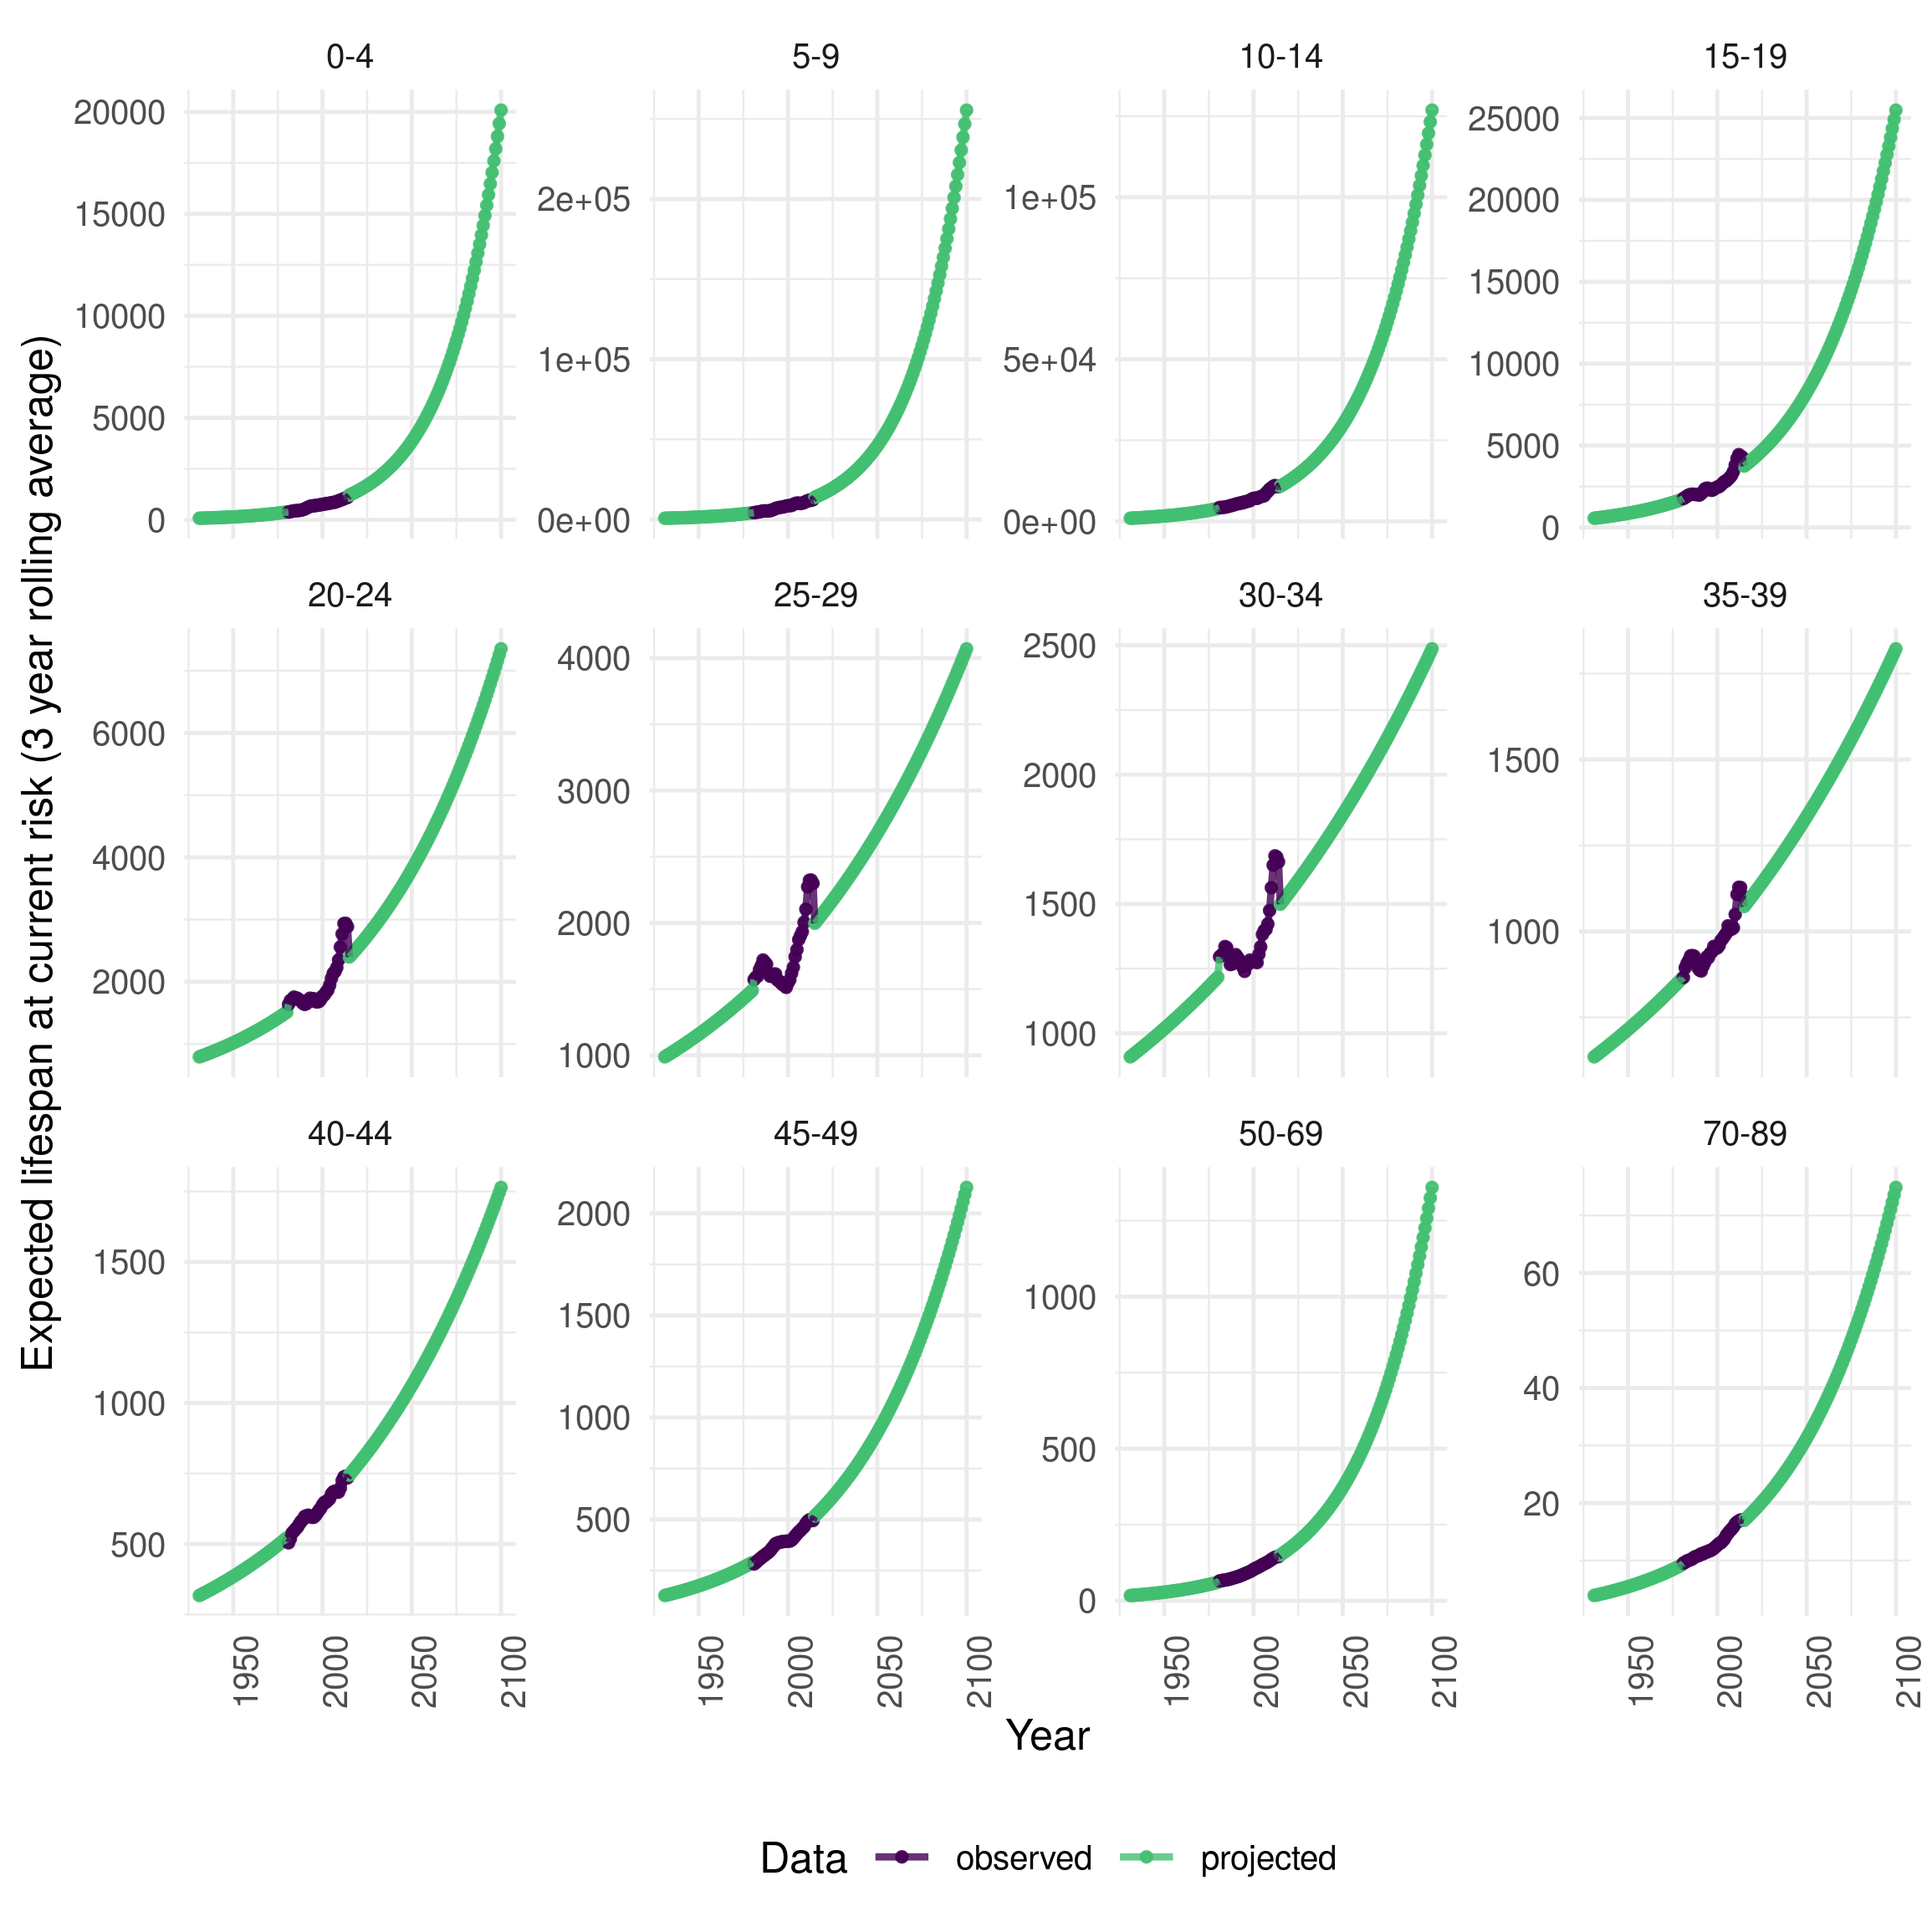
Figure 8.8: Three year rolling average expected remaining lifespan stratified by age group in England from 2000 to 2014. Age is grouped into 5 year age groups from 0 to 49, from 50-69, and from 70 to 89. Those aged 90+ are excluded due to low quality data. The age groups used here represent those used in the model. Data from this figure was sourced from the ONS age-specific mortality rate estimates with projections based on an age-stratified exponential model.
8.6 Initialisation
Dynamics transmission models are affected by the conditions under which they are initialised.[7] For models of endemic disease this can be problematic as the full disease outbreak can often not be modelled, due to a lack of data and the changing nature of the endemic over time. A common approach to minimise this issue is to initialise the model with an uninformative set of initial conditions and then run the model for a period of time, known as the burn-in period, until steady state dynamics have developed.[7] Models that include demographic processes are more complex to burn-in as demographic data is typically required to initialise the model so that it has the demographics observed during the period of time modelled.
8.6.1 Starting simulation date, initial population and changes over time.
Model simulations are initiated in 1931 due to the availability of population data from the 1931 census and because data on live births is only available from 1929. The demographic model is initialised using the age grouped 1931 census data with the assumption that the entirety of the population is UK born. Initially it is assumed that there is no BCG vaccination and recovery from active TB takes 2 years. TB treatment is assumed to begin in 1952 with the discovery of isoniazid and BCG vaccination begins at school-age (15 years old) in 1953. BCG vaccination coverage is assumed to vary randomly over the time horizon of the model but to have the same distribution at all time points. The assumed distribution is normal with a mean of 75% and a standard deviation of 5%. The duration with active TB is assumed to decrease from the introduction of treatment in 1952 through to 1990 when it is assumed that detection rates were equivalent to those seen today.
8.6.2 Initial disease distribution
The model is initialised with the number of pulmonary and extra-pulmonary cases reported in 1931. The high risk latent population is initialised by scaling the number of observed cases in 1931 by the proportion of high risk latent cases that develop active TB, the duration that these cases are high risk and then dividing by the infectious period. The low risk latent population is then initialised by scaling the high risk latent population by the cumulative sum of the age distribution of UK born cases in 2000, reduced by 50% to account for mortality (approximately 5% of the population). Finally, the initial susceptible population is based on the population estimate from the 1931 census minus the assumed initial latent cases.
All initial disease compartments, excepting the low risk latent compartment, are distributed based on the age distribution of observed UK born cases in 2000. To account for possible measurement error a normal distribution is sampled around the assumed population in each compartment with a standard deviation of 5% of the reported cases.
8.7 Scenarios
All dynamic transmission models require a series of assumptions to be made. These assumptions fall into two categories: structural assumptions and parameter assumptions.[121] Structural assumptions, such as the choice of serial latency in the model presented here, maybe difficult to test as they require the development of a parallel model structure. In the model presented here I have chosen to base the model structure on the known epidemiology of TB in England and the effects of the BCG vaccine. Structural assumptions have been discussed as have their potential impacts but a full scenario analysis of all potential model structures is beyond the scope of this work. Instead, I have focused on parameter assumptions which are more likely to directly impact the evaluation of BCG vaccination.
During model fitting, I will consider the evidence for modifying the transmission probability, and non-UK born mixing, by age using three distinct scenarios (Table 8.5). These scenarios aim to test some of the key modelling assumptions made here. Identifying if the transmission probablity, or non-UK born mixing, varies with age is important as it may alter the distribution and number of TB cases. This would impact the observed effects of the BCG vaccine and is therefore of primary importance.
| Parameter | Scenario |
|---|---|
| \(\beta_a\) - transmission probability | Constant across all age groups |
| Variable in young adults (15-29) | |
| \(M\) - Non-UK born mixing | Constant across all age groups |
| Variable in young adults (15-29) |
8.8 Discussion
In this chapter, I have outlined the requirements for a dynamic transmission model of TB in order for it to be able to answer policy relevant questions relating to BCG vaccination in England. I then outlined, and gave the equations for, a model that met these requirements and made use of the data available. I defined prior distributions for each model parameter and initialisation conditions. I then detailed the data sources used for parameterisation, approximations required to make best use of the available data, and the scenario analyses needed to explore model, parameterisation and initialisation assumptions.
This chapter has outlined a realistic dynamic transmission model of TB that includes the key features required to investigate BCG vaccination policy and is robustly parameterised from an extensive, and previously unused in a TB model, routine surveillance dataset. Transformations, and approximations, of parameters have been used to make the best use of available data. However, there are several key limitations. Firstly, the model presented here does not explicitly model TB transmission in the non-UK born. This means that in order to initialise the model assumptions must be made about the historic number of non-UK born cases and the future incidence in the non-UK born must also be assumed in order to produce projections of future TB incidence. However, this simplification allows many complexities of TB in the non-UK born to be discounted, such as the rate of case importation, heterogeneity amongst the non-UK born from different countries, and mixing within the non-UK born. Secondly, the model presented here does not include high and low risk stratification within the UK born. Individuals that are from countries with incidence above 40 per 100,000, or that have parents/grandparents from countries with incidence above 40 per 100,000, are considered at higher risk of TB.[47] In addition, individuals living in areas of the UK with incidence above this threshold are also considered at higher risk. Current BCG vaccination policy targets high risk neonates for vaccination, with low risk neonates not being vaccinated. Ideally, this high/low risk stratification would be included as it would allow the evaluation of the current BCG vaccination policy. This has not been possible as there is little data from which to extrapolate either the number of high risk notifications in the ETS,[21] or the size of the high risk population. There is also little evidence to suggest the degree of mixing between the non-UK born, the high risk UK born population and the low risk non-UK born population. It is likely that introducing this structure into the model, without the data outlined above, would lead to the model being poorly specified and therefore failing to fit to the observed data. Instead, in the final chapter in this thesis, the high risk neonatal programme will be proxied by a universal neonatal programme. This will allow for a comparison to be made between school-age and neonatal vaccination but does not allow for the impact of targeting high risk individuals to be evaluated. Finally, the model presented here does not include the full complexity of TB epidemiology. Drug resistant TB may have more severe outcomes, standard TB treatment may fail resulting in a longer period on treatment, and TB outcomes may vary by risk group.[2] However, drug resistant TB cases are known to make up a small fraction of TB cases in England in the UK born, and variable treatment times have been included in the prior distribution of treatment times and TB outcomes. Model parameters have also been stratified by pulmonary status and age group where appropriate. Additionally, complexity has been included for the action of the BCG vaccine, with realistic waning in effectiveness. Observed age-specific mortality rates and the number of live births has also been included, allowing for realistic population demographics. This means that estimates of the impact of the change in vaccination policy are likely to be more accurate, whereas a more complex model of the epidemiology of TB would likely have little impact on these results.
There are several key differences between the model presented here and others that have been previously been published that modelled TB transmission in low incidence settings or evaluated BCG vaccination policy. These are: the inclusion of dynamic TB transmission; robust parameterisation from an extensive surveillance dataset; realistic population demographics; and detailed modelling of the action of the BCG vaccine. Several previous studies have evaluated the role of BCG vaccination at a population level and estimated the impact of targeting different age groups and populations. Manissero et al. estimated the impact of various BCG vaccination strategies in low-intermediate incidence settings using an annual risk of infection model based on an approach previously published by Trunz et al. [103,104] This approach estimates the number of new cases generated by a single smear positive case per year in a birth cohort. Only a single year of data was used to parameterise the model and age structure, the duration of protection from BCG vaccination and the different types of protection conferred by BCG vaccination were not considered. Rahman et al. compared the cost effectiveness of universal BCG vaccination to no vaccination using a cohort model of Japanese infants.[105] Their model did not include TB transmission and used an estimated duration of protection from BCG of 10 years. Similarly Usher et al. used a decision analytical model to follow a birth cohort to compare universal, selective or no BCG vaccination.[72] As in the previous study, TB transmission was not included. The model I have presented here includes TB transmission and uses more recent estimates of the effectiveness of the BCG vaccine to capture the full benefits of vaccination.
Several studies have made use of dynamic TB transmission models to evaluate BCG vaccination or future vaccines.[100,106,122] In general, these studies used less detailed models than the one presented here, typically because they were modelling TB in a more generic setting or because more information about TB epidemiology, TB natural history, and the BCG vaccine has become available over time. In addition, no dynamic model of TB, including BCG vaccination, has currently been published that includes both protection from initial infection and protection from active TB due to BCG vaccination. There have also been no studies that use the current best estimates for the duration of BCG protection in developed countries away from the equator. Harris et al. reviewed mathematical models that explored the epidemiological impacts of future TB vaccines. They found that vaccines targeted at all-ages or at adolescents/adults were more effective at eradicating TB than neonatal programmes when vaccine effectiveness was not assumed to degrade with age. The majority of studies included in their review used deterministic, compartmental, dynamic models. Model structures were found to have evolved over time as TB natural history and epidemiology is better understood, with the majority of models having at least susceptible, latent, active disease, and recovered states. Treatment status, variable infectiousness of active disease, vaccine waning, and age stratification were included in some of the models evaluated.[100] Recently it has been shown that only models that include at least two latent compartments are able to reproduce the observed activation dynamics of TB.[101] The model presented here is based on the serial latency archetype identified in this study. It has also been shown that realistic age structure and population demographics, included in the model presented in this chapter, are critical for reproducing TB epidemiology.[102] Egbetade et al. presented a dynamic model of TB that included BCG vaccination but did not include age structure. They found that universal vaccination increased the stability of the disease free equilibrium in countries with high TB burden. However the model presented was not rigorously parameterised with data and only a single latent TB compartment was used.[122] Bhunu et al. developed a dynamic transmission model of TB that in order to investigate the effects of pre- and post-exposure vaccines for TB control. Again their model did not include multiple latent compartments or age structure unlike the model presented here.[106]
Vynnycky et al. modelled the long term dynamics of pulmonary TB, in England and Wales, in the white male population using a deterministic TB transmission model that included; high and low risk latent periods, reinfection, BCG vaccination, TB specific and all-cause mortality.[99] Whilst this is a highly detailed and well parameterised modelling study more recent developments such as survey derived age stratified contact matrices, evidence that BCG provides protection against initial infection as well as active TB disease and parameter estimates for TB activation stratified by age are included in the model presented here. In addition, their study only modelled TB transmission until 1990, allowing them to ignore the contribution of non-UK born cases. The model presented in this chapter includes non-UK born cases, via the force of infection, as they are now thought to be a key driver of TB transmission in England.
Dowdy et al. presented a data wish list for evidence base decision making using TB models, which may be used to assess the usefulness of a TB model for policy makers. The data requirements included: the rate of TB transmission; probability of developing active disease after an initial infection; the rate of activation amongst cases with risk factors; protection afforded by latent TB infection; the duration of infectiousness; treatment success; and the rate of spontaneous recovery. The model presented here fulfills the majority of these criteria. The rate of TB transmission is parameterised using previously published estimates of the effective contact rate in England,[118] this parameterisation will be refined in the following chapter using incidence data from the ETS. The probability of developing active TB has been sourced from recently published modelling work that fit a model of TB transmission to contact data in low incidence countries,[101] and is stratified by age as considered important by Dowdy et al. The rate of activation amongst cases with risk factors has not been included as it has been assumed that the proportion of UK born cases in the ETS with risk factors such as HIV is low. The duration of infectiousness, and treatment success have been parameterised using the ETS, although this approach is limited by possible reporting biases in the data available. The rate of spontaneous recovery has not been modelled as it is assumed that individuals are likely to be notified before clearing TB and are also likely to rapidly be started on TB treatment. This assumptions is likely to be valid as England has a robust national health service and a strong notification framework for TB. The protection afforded by latent TB infection has been included using the most recent literature sources available. All other parameters have been parameterised using the ETS where possible and otherwise from the most robust literature sources available. In particular the effectiveness of the BCG vaccine has been parameterised using data from studies that took place in England, where available, and both the protection from initial infection and the protection from developing active disease in those latently infected has been included along with estimates of the reduction in protection over time.
The transmission dynamic model of TB transmission and BCG vaccination presented in this chapter provides a detailed overview of the features required to reproduce the observed epidemiology of TB in England. The model was robustly parameterised using routine surveillance data where available and otherwise using literature sources. The assumptions required by the model can be explored by fitting the model to observed data and assessing the goodness of fit. This is the focus of the next chapter. In addition the model may also be used to explore the impact of current and historic BCG vaccination policy, both in the observed data and projected into the future. Both of these scenarios are explored in the final chapter of this thesis.
8.9 Summary
This chapter presents a transmission dynamic model of TB transmission and BCG vaccination. The model includes; age structure, pulmonary and extra-pulmonary TB, re-infection and re-activation, serial latency, TB treatment, treatment failure, TB mortality, non-UK born cases and details of the historic TB endemic. Code for this model is available online.30
The model has been robustly parameterised to a rich routine surveillance data set, which has allowed more complex features to be modelled than in previously published models. Parameter transformation and approximations, that make the best use of the available data, have been detailed.
The assumptions required by the model have been explored in detail, with the required sensitivity analyses listed. These sensitivity analyses will be explored in the following chapter by comparing the goodness of fit of the model to the available data.
The strengths and weaknesses of the model have been discussed as well as its context within the literature. It appears that few models are parameterised to a comparably rich surveillance data source, that few models capture the full complexity of BCG vaccination and that few models include realistic population demographics to the same extent as included in the model presented in this chapter.
Chapter 5 used a simple simulation model to estimate the impact of the 2005 change in BCG vaccination policy and Chapter 7 used Poisson and Negative Binomial multilevel models to estimate the observed impact of the change in policy on incidence rates in the directly effected populations. Whilst these approaches are valid they cannot estimate the indirect effects of policy changes, nor can they predict the future impacts of BCG vaccination policy. For this a transmission dynamic model, as presented here, is required. In the following chapter this model will be fit to available TB data and the impact of various BCG vaccination policies will be explored.
References
2 Public Health England. Tuberculosis in England 2017 report ( presenting data to end of 2016 ) About Public Health England. 2017.
4 Roy A, Eisenhut M, Harris RJ et al. Effect of BCG vaccination against Mycobacterium tuberculosis infection in children: systematic review and meta-analysis. BMJ (Clinical research ed) 2014;349:g4643–3.
5 Zwerling A, Behr MA, Verma A et al. The BCG world atlas: A database of global BCG vaccination policies and practices. PLoS medicine 2011;8:e1001012.
7 Anderson RM, May RM. Infectious Diseases of Humans: Dynamics and Control (Oxford Univ. Press, Oxford 1991.
8 Keeling MJ, Rohani P. Modeling Infectious Diseases in Humans and Animals. Epidemiology Department, Ben-Gurion University of the Negev, Beer-Sheva, Israel. rbalicer@netvision.net.il: 2007.
12 Gideon HP, Flynn JL. Latent tuberculosis: What the host "sees"? Immunologic Research 2011;50:202–12.
13 Sepkowitz K. How contagious is tuberculosis? Clinical infectious diseases : an official publication of the Infectious Diseases Society of America 1996;23:954–62.
18 World Health Organization. Global Tuberculosis Report. 2016.
21 Public Health England. Tuberculosis in England: 2018. 2019;1–218.
23 Rodrigues LC, Diwan VK, Wheeler JG. Protective effect of BCG against tuberculous meningitis and miliary tuberculosis: a meta-analysis. International journal of epidemiology 1993;22:1154–8.
24 Colditz GA, Brewer TF, Berkey CS et al. Efficacy of BCG Vaccine in the Prevention of Tuberculosis. JAMA 1994;271:698.
25 Mangtani P, Abubakar I, Ariti C et al. Protection by BCG Vaccine Against Tuberculosis: A Systematic Review of Randomized Controlled Trials. Clinical infectious diseases : an official publication of the Infectious Diseases Society of America 2014;58:470–80.
26 Hart PDA, Sutherland IAN. BCG and vole bacillus vaccines in the prevention of tuberculosis in adolescence and early adult life. The American Statistician 1972;46:371–85.
27 Zwerling A, Behr MA, Verma A et al. The BCG World Atlas: a database of global BCG vaccination policies and practices. PLoS medicine 2011;8:e1001012.
28 Abubakar I, Pimpin L, Ariti C et al. Systematic review and meta-analysis of the current evidence on the duration of protection by bacillus Calmette-Guérin vaccination against tuberculosis. Health technology assessment 2013;17:1–372, v–vi.
29 Mangtani P, Nguipdop-Djomo P, Keogh RH et al. Original article The duration of protection of school-aged BCG vaccination in England : a population -based case control study. International journal of epidemiology 2017;0:1–9.
47 Public Health England. The Green Book. 2013;391–409.
72 Usher C, Adams R, Schmitz S et al. Evaluating the neonatal BCG vaccination programme in Ireland. Archives of Public Health 2016;74:1–12.
99 Vynnycky E, Fine PE. The annual risk of infection with Mycobacterium tuberculosis in England and Wales since 1901. Int J Tuberc Lung Dis 1997;1:389–96.
100 Harris RC, Dodd PJ, White RG. The potential impact of BCG vaccine supply shortages on global paediatric tuberculosis mortality. BMC Med 2016;14:138.
101 Ragonnet R, Trauer JM, Scott N et al. Optimally capturing latency dynamics in models of tuberculosis transmission. Epidemics 2017;21:39–47.
102 Brooks-Pollock E, Cohen T, Murray M. The impact of realistic age structure in simple models of tuberculosis transmission. PLoS ONE 2010;5:3–8.
103 Manissero D, Lopalco PL, Levy-Bruhl D et al. Assessing the impact of different BCG vaccination strategies on severe childhood TB in low-intermediate prevalence settings. Vaccine 2008;26:2253–9.
104 Trunz BB, Fine P, Dye C. Effect of BCG vaccination on childhood tuberculous meningitis and miliary tuberculosis worldwide: a meta-analysis and assessment of cost-effectiveness. Lancet 2006;367:1173–80.
105 Rahman M, Sekimoto M, Takamatsu I et al. Economic evaluation of universal BCG vaccination of Japanese infants. International journal of epidemiology 2001;30:380–5.
106 Bhunu CP, Garira W, Mukandavire Z et al. Modelling the effects of pre-exposure and post-exposure vaccines in tuberculosis control. Journal of Theoretical Biology 2008;254:633–49.
107 Brooks-Pollock E, Cohen T, Murray M. The impact of realistic age structure in simple models of tuberculosis transmission. PLoS ONE 2010;5:3–8.
108 Menzies NA, Wolf E, Connors D et al. Review Progression from latent infection to active disease in dynamic tuberculosis transmission models : a systematic review of the validity of modelling assumptions. Lancet Infect Dis 2018;3099.
109 Mathema B, Andrews JR, Cohen T et al. Drivers of Tuberculosis Transmission. J Infect Dis 2018;216:S644–53.
110 Lefebvre N, Sotgiu G, Falzon D et al. Determinants of site of tuberculosis disease : An analysis of European surveillance data from 2003 to 2014. 2017;1–14.
111 Shaw JB, Wynn-Williams N. Infectivity of pulmonary tuberculosis in relation to sputum status. American review of tuberculosis 1954;69:724–32.
112 Tostmann A, Kik SV, Kalisvaart NA et al. Tuberculosis Transmission by Patients with Smear- Negative Pulmonary Tuberculosis in a Large Cohort in The Netherlands. Clinical Infectious Diseases 2008;47:1135–42.
113 Piccini P, Chiappini E, Tortoli E et al. Clinical peculiarities of tuberculosis. BMC Infect Dis 2014;14 Suppl 1:S4.
114 Houben RMGJ, Lalli M, Sumner T et al. TIME Impact - a new user-friendly tuberculosis (TB) model to inform TB policy decisions. BMC Medicine 2016;14:1–10.
115 Andrews JR, Lawn SD, Rusu C et al. The cost-effectiveness of routine tuberculosis screening with Xpert MTB/RIF prior to initiation of antiretroviral therapy: a model-based analysis. Aids 2012;26:987–95 10.1097/QAD.0b013e3283522d47.
116 Vynnycky E, Fine PE. The natural history of tuberculosis: the implications of age-dependent risks of disease and the role of reinfection. Epidemiology and infection 1997;119:183–201.
117 Houben RM, Lalli M, Sumner T et al. TIME Impact - a new user-friendly tuberculosis (TB) model to inform TB policy decisions. BMC Med 2016;14:56.
118 Vynnycky E, Fine PE. Interpreting the decline in tuberculosis: the role of secular trends in effective contact. Int J Epidemiol 1999;28:327–34.
119 Hens N, Jit M, Beutels P et al. Social Contacts and Mixing Patterns Relevant to the Spread of Infectious Diseases. PLoS medicine 2008;5:e74.
120 Lalor MK, Anderson LF, Hamblion EL et al. Recent household transmission of tuberculosis in England, 2010-2012: Retrospective national cohort study combining epidemiological and molecular strain typing data. BMC Medicine 2017;15:1–10.
121 Dowdy DW, Dye C, Cohen T. Data needs for evidence-based decisions : a tuberculosis modeler’s wish list. International Journal of Tuberculosis and Lung Disease 2013;17:866–77.
122 Egbetade S, Polytechnic T, Ibrahim MO. Modelling The Impact of BCG Vaccines on Tuberculosis Epidemics. 2011;1:49–55.
Model code: https://github.com/seabbs/ModelTBBCGEngland/blob/master/inst/bi/BaseLineModel.bi↩
https://github.com/seabbs/ModelTBBCGEngland/tree/master/data-raw↩
socialmixr: https://github.com/sbfnk/socialmixr↩Model code: https://github.com/seabbs/ModelTBBCGEngland/blob/master/inst/bi/BaseLineModel.bi↩