Chapter 2 Background
2.1 Tuberculosis
Tuberculosis (TB) is thought to infect over 1.7 billion people globally, of which 5-15% will develop active (symptomatic) TB in their lifetime.[11] Of those with active TB around 10% are likely to die from TB or TB related causes.[3] TB is preventable and curable, but the majority of active cases occur in less economically developed countries and may not be diagnosed.[3] In the following section, the natural history of TB, TB risk factors, TB treatment, global impact, and the impact TB in England and Wales are explored.
2.1.1 Natural history of TB
TB is primarily a respiratory disease (pulmonary TB) caused by the bacterium Mycobacterium tuberculosis, although it can also affect other parts of the body (extra-pulmonary TB). TB spreads via airborne droplets that are expelled when individuals with active pulmonary TB cough. After infection with TB, 5-10% of individuals develop primary disease within 1-2 years of exposure. Children are more likely to develop active disease and to develop it more quickly than adults.[3] The remaining 90-95% of individuals then enter a latent stage in which they passively carry TB mycobacterium. Reactivation of bacilli can then occur many years later due to a loss of immune control.[12]
Both active and latent TB represent a range of diverse individual states. Pulmonary cases are typically responsible for the vast majority of transmission.[13] Latent cases may completely clear the bacterium or be asymptotically carrying reproducing active TB bacterium.[12] Adolescents have the highest risk of developing active TB, usually in the form of pulmonary TB.[3] The risk of developing pulmonary TB, versus extra-pulmonary TB, varies with age. For instance, younger children are more likely to develop pulmonary TB.[3]
The most common symptoms are a chronic cough with sputum containing blood, fever, night sweats and weight loss. Infectiousness, mortality and likelihood of developing various types of TB vary with age.
2.1.2 Risk factors
TB has been associated with several risk factors, the most common of which is human immunodeficiency viruse (HIV). HIV increases the rate of activation 20-fold and TB is the most common cause of AIDS-related death.[14] Increased risk of TB can also be the result of other medical conditions, such as diabetes, or lifestyle and environmental factors. These include smoking, low socioeconomic status, high density living, homelessness, incarceration, and drug use.[15–17]
2.1.3 Treatments
Treatment for TB consists of a six month course of multiple antibiotics (see Table 2.1). These usually consist of isoniazid, rifampicin, pyrazinamide and ethambutol (known as first line drugs). If the disease is resistant to treatment with the first line drugs then second line drugs such as aminoglycosides, fluoroquinolones, and cycloserine are employed. The side effects for these drugs are generally far more severe and the treatment regime is longer, typically 12-24 months. The World Health Organization (WHO) now recommends the use of the Directly Observed Treatment short-course (DOTS), which focuses on 5 action points.[18] These are:
- political commitment with increased and sustained financing,
- case detection through quality-assured bacteriology,
- standardized treatment with supervision and patient support,
- an effective drug supply and management system,
- monitoring and evaluation system and impact measurement.
| Year | Intervention | Type | Line | Detail |
|---|---|---|---|---|
| 1921 | BCG | Vaccination | The first use of the Bacillus Calmette–Guerin (BCG) vaccine in humans, it remains the only vaccine against Tuberculosis (TB). Efficacy has been shown to vary depending on latitude and there is only strong evidence of protection for 10-15 years after vaccination. | |
| 1944 | Streptomycin | Antibiotic | Second | The first antibiotic and the first bacterial agent against TB. |
| 1944 | 4-Aminosalicylic acid | Antibiotic | Second | The second antiobiotic to be developed. Due to lower potency than other antibiotics it is not considered a first line treatment. |
| 1952 | Isoniazid | Antibiotic | First | Used against both active and latent TB, it may also be given as a prophylatic therapy. |
| 1952 | Cycloserine | Antibiotic | Second | An antibiotic with severe side effects such as kidney failure and neurological conditions, which is therefore restricted for use against multiple drug resistant TB. |
| 1952 | Pyrazinamide | Antibiotic | First | Discovered in 1936, it was first used against TB in 1952. Although showing no effect in-vitro it was shown to be effective in treating TB in mice. Used only for treating TB and never on its own. |
| 1953 | School age BCG | Vaccination | After a successful trial which showed high effectiveness for the vaccine, BCG was introduced in the UK for those at school leaving age as peak incidence was then in young, working adults. | |
| 1962 | Ethambutol | Antibiotic | First | Believed to work by interfering with TB bacteria’s metabolism. There are some concerns that it may not be safe to give during pregancy, as it may lead to vision loss in the baby. |
| 1971 | Rifampicin | Antibiotic | First | Taken daily for at least a period of 6 months, if given alone resistance develops quickly. It may also be used in the treatment of MRSA amongst other diseases. |
| 1995 | DOTS | Strategy | Directly Observed Treatment, Short-Course (DOTS) is introdued by the World Health Organization as a control strategy for TB. The intermittent, supervised system aims to eliminate drug default. | |
| 2005 | Neonatal high risk BCG | Vaccination | Due to a continued decline in TB incidence rates in the indigenous UK population, the BCG programme was refocused as risk-based. This meant vaccinating high risk neonates rather than those most likely to transmit TB. | |
| 2012 | Bedaquiline | Antibiotic | Second | The first new antiobiotic for use against TB in 40 years, reserved for use against multiple drug resistant TB. Approved via a fast track process, higher mortality in those that recieve the antibiotic has caused significant concern. |
2.1.4 Global TB
TB is a global disease with an estimated 10.4 million new cases in 2016,[3] of which 4.3 million were estimated to have been missed by health systems.[19] Global incidence rates have decreased year-on-year since the early 2000s, with an average year-on-year decrease of 2.9%. However, global TB incidence remains above 134 per 100,000 population (Figure 2.1). On a regional level, incidence rates vary, with Africa and South-East Asia having a greater concentration of cases. In the Eastern Mediterranean, incidence rates have remained relatively stable over the last 10 years.
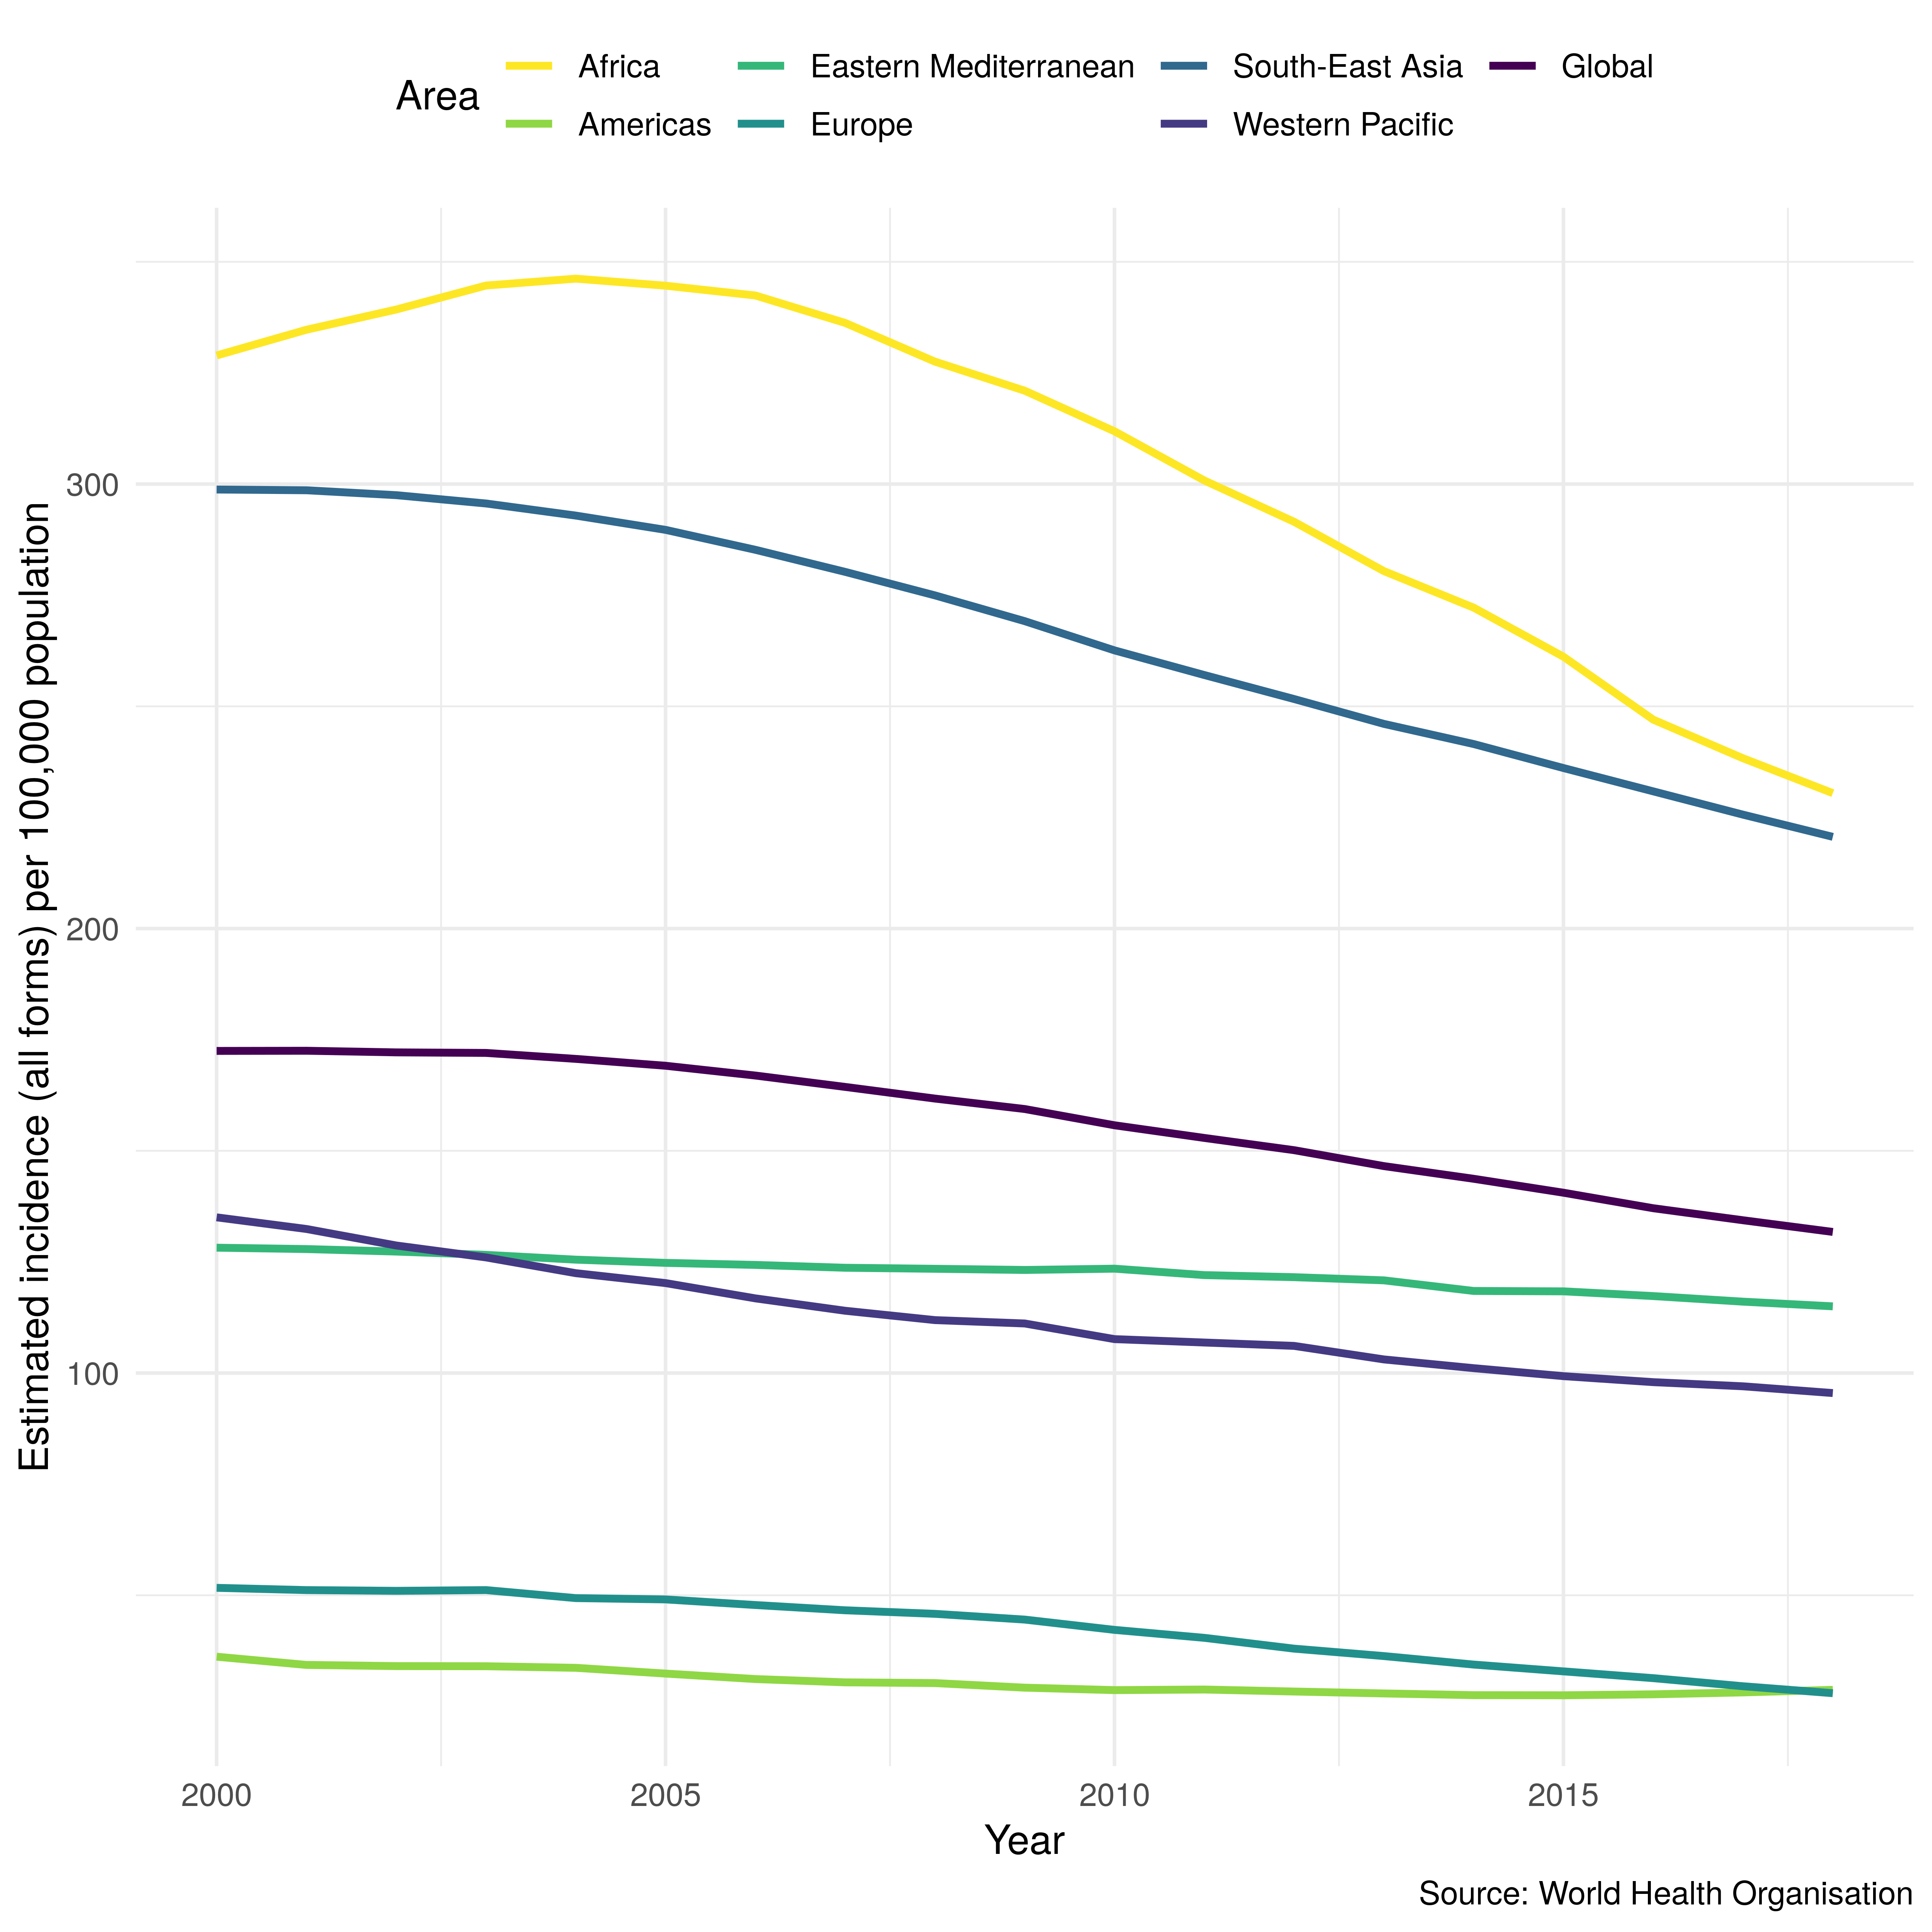
Figure 2.1: TB incidence rates (per 100,000) by region and globally from 2000 until 2017. Globally incidence rates have been declining since the early 2000s but this decline varies with region.
Regional incidence rates only tell part of the story, as TB incidence rates vary significantly within regions. India, Indonesia, China, Nigeria, Pakistan, and South Africa account for 60% of new cases. India, Indonesia, and Nigeria are thought to be responsible for nearly half of all undiagnosed cases.[18] Figure 2.2 shows both regional similarities and countries, like Mongolia, that stand out as having higher TB incidence rates than surrounding countries.
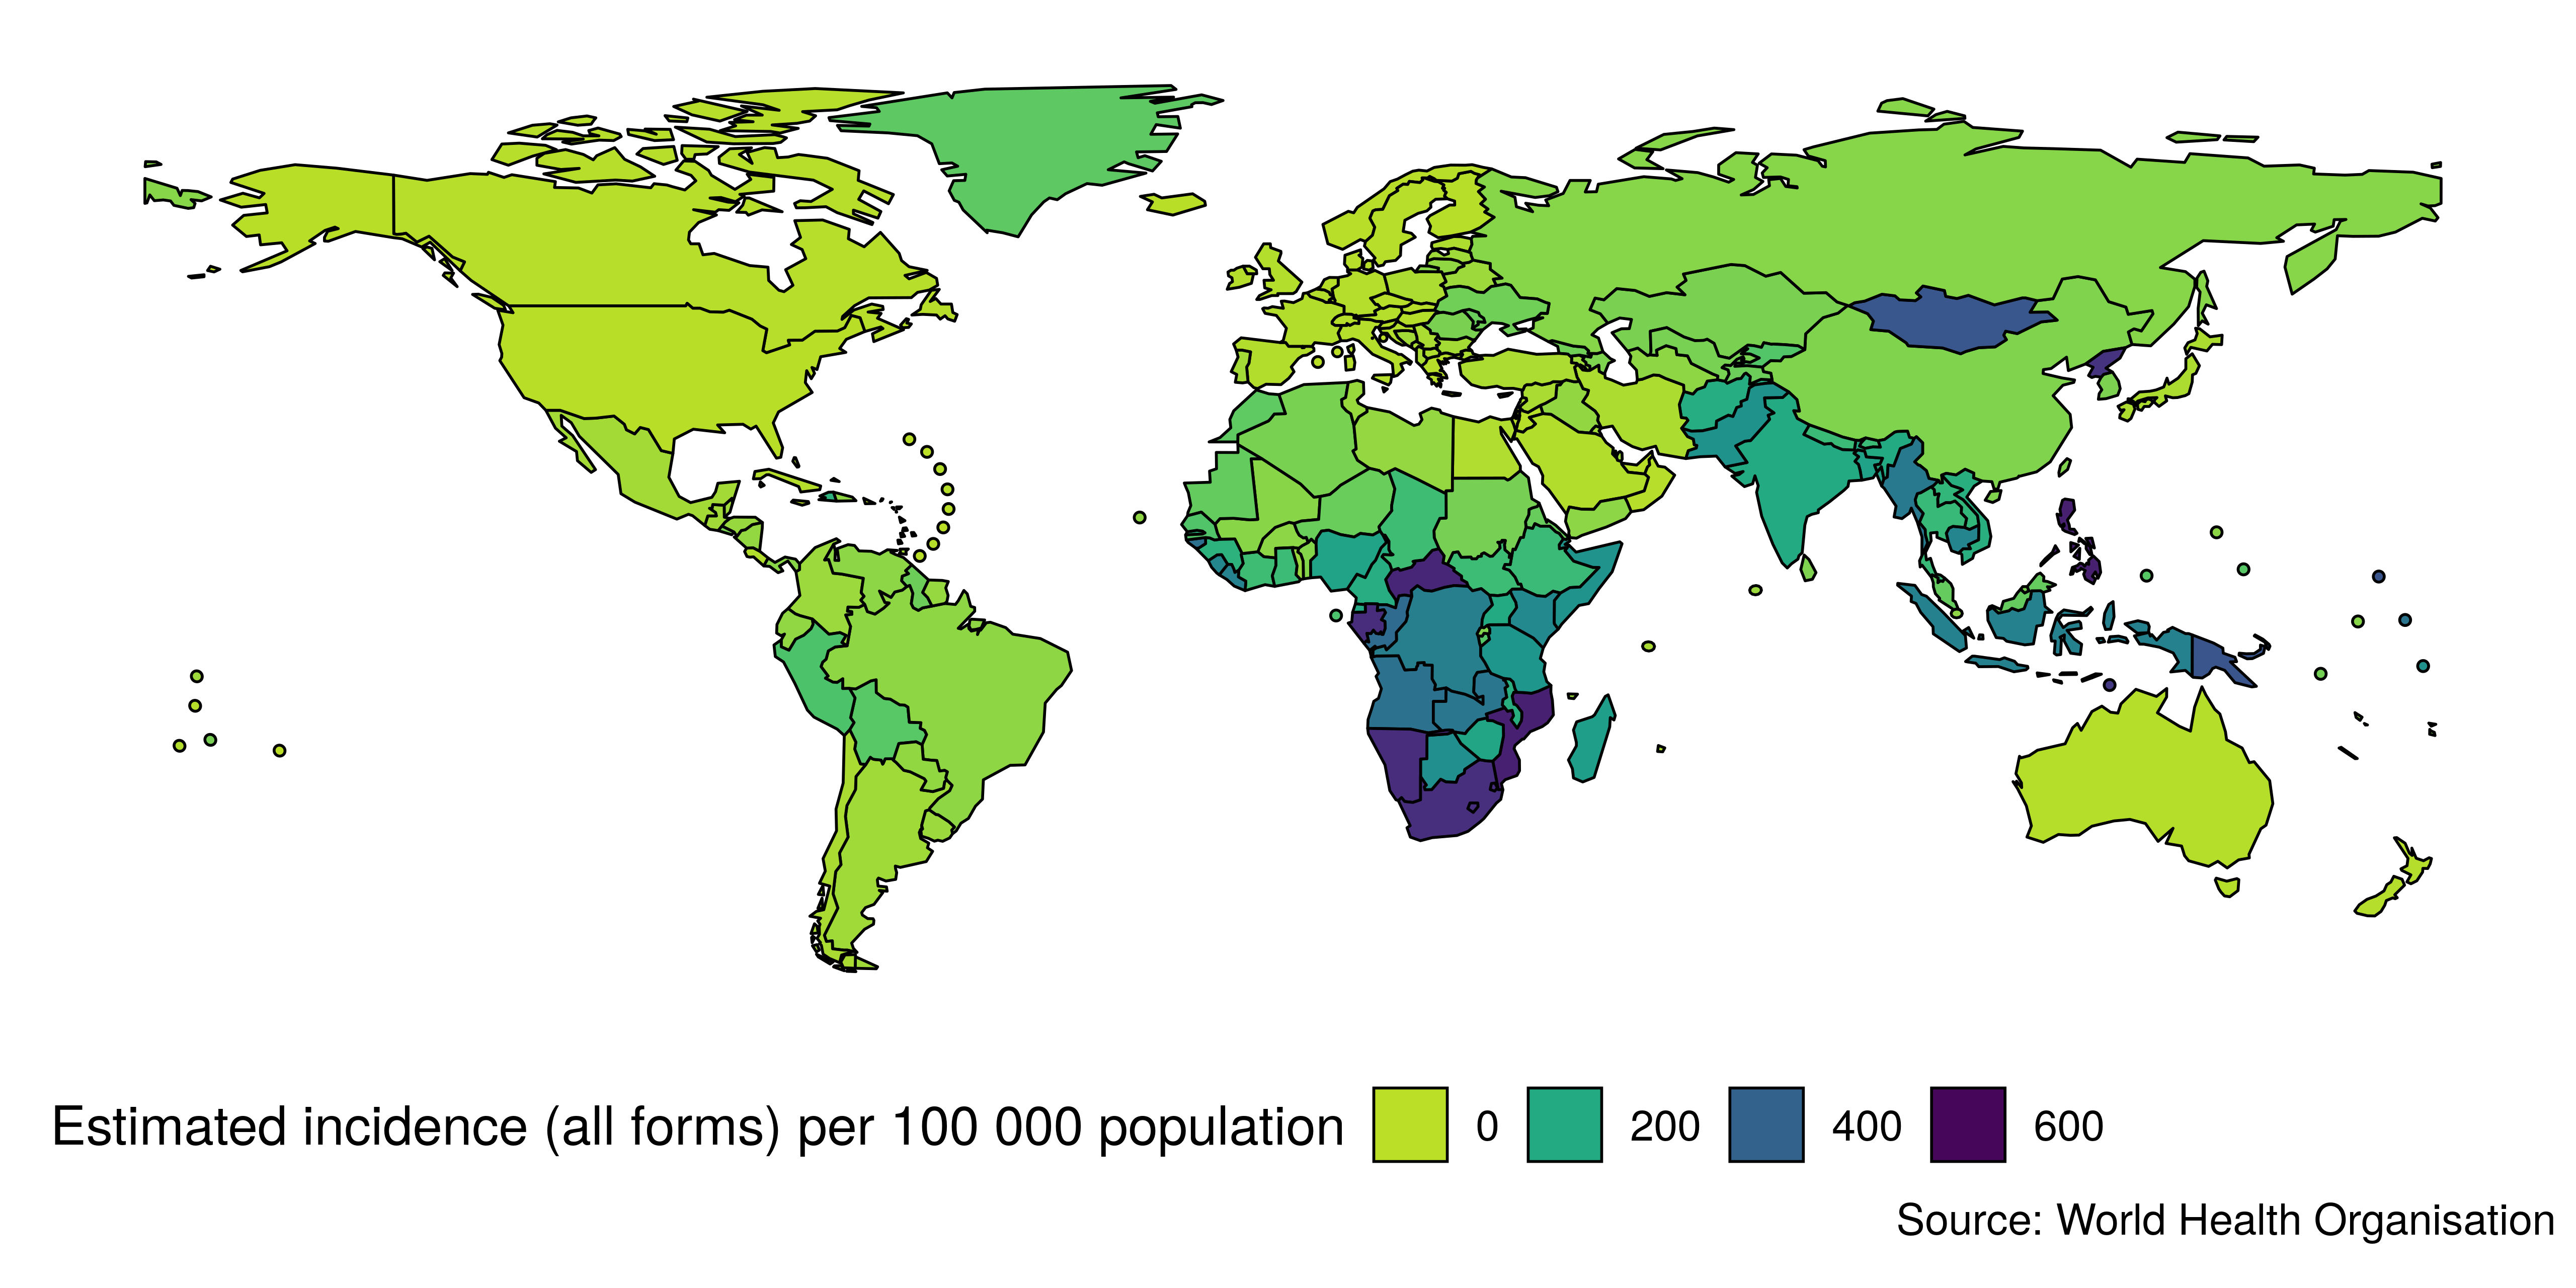
Figure 2.2: Global map of country level TB incidence rates (per 100,000 population) in 2017. Note the clustering of countries with high incidence rates in southern and central Africa and southern Asia. Incidence rates in the legend refer to the lower bound for each colour.
TB remains one of the top 10 causes death worldwide, leading to 1.7 million deaths in 2016 alone.[3] The absolute number of deaths due to TB has fallen since 2000, with an average annual global rate of decline in TB mortality rates of 2.9% between 2000-2016. Unlike the trend observed for incidence rates, the year-on-year decline of TB mortality rates has remained consistent in all regions (Figure 2.3). Several regions, including Africa and Europe, have seen TB mortality rates fall to below 50% of those in 2000.
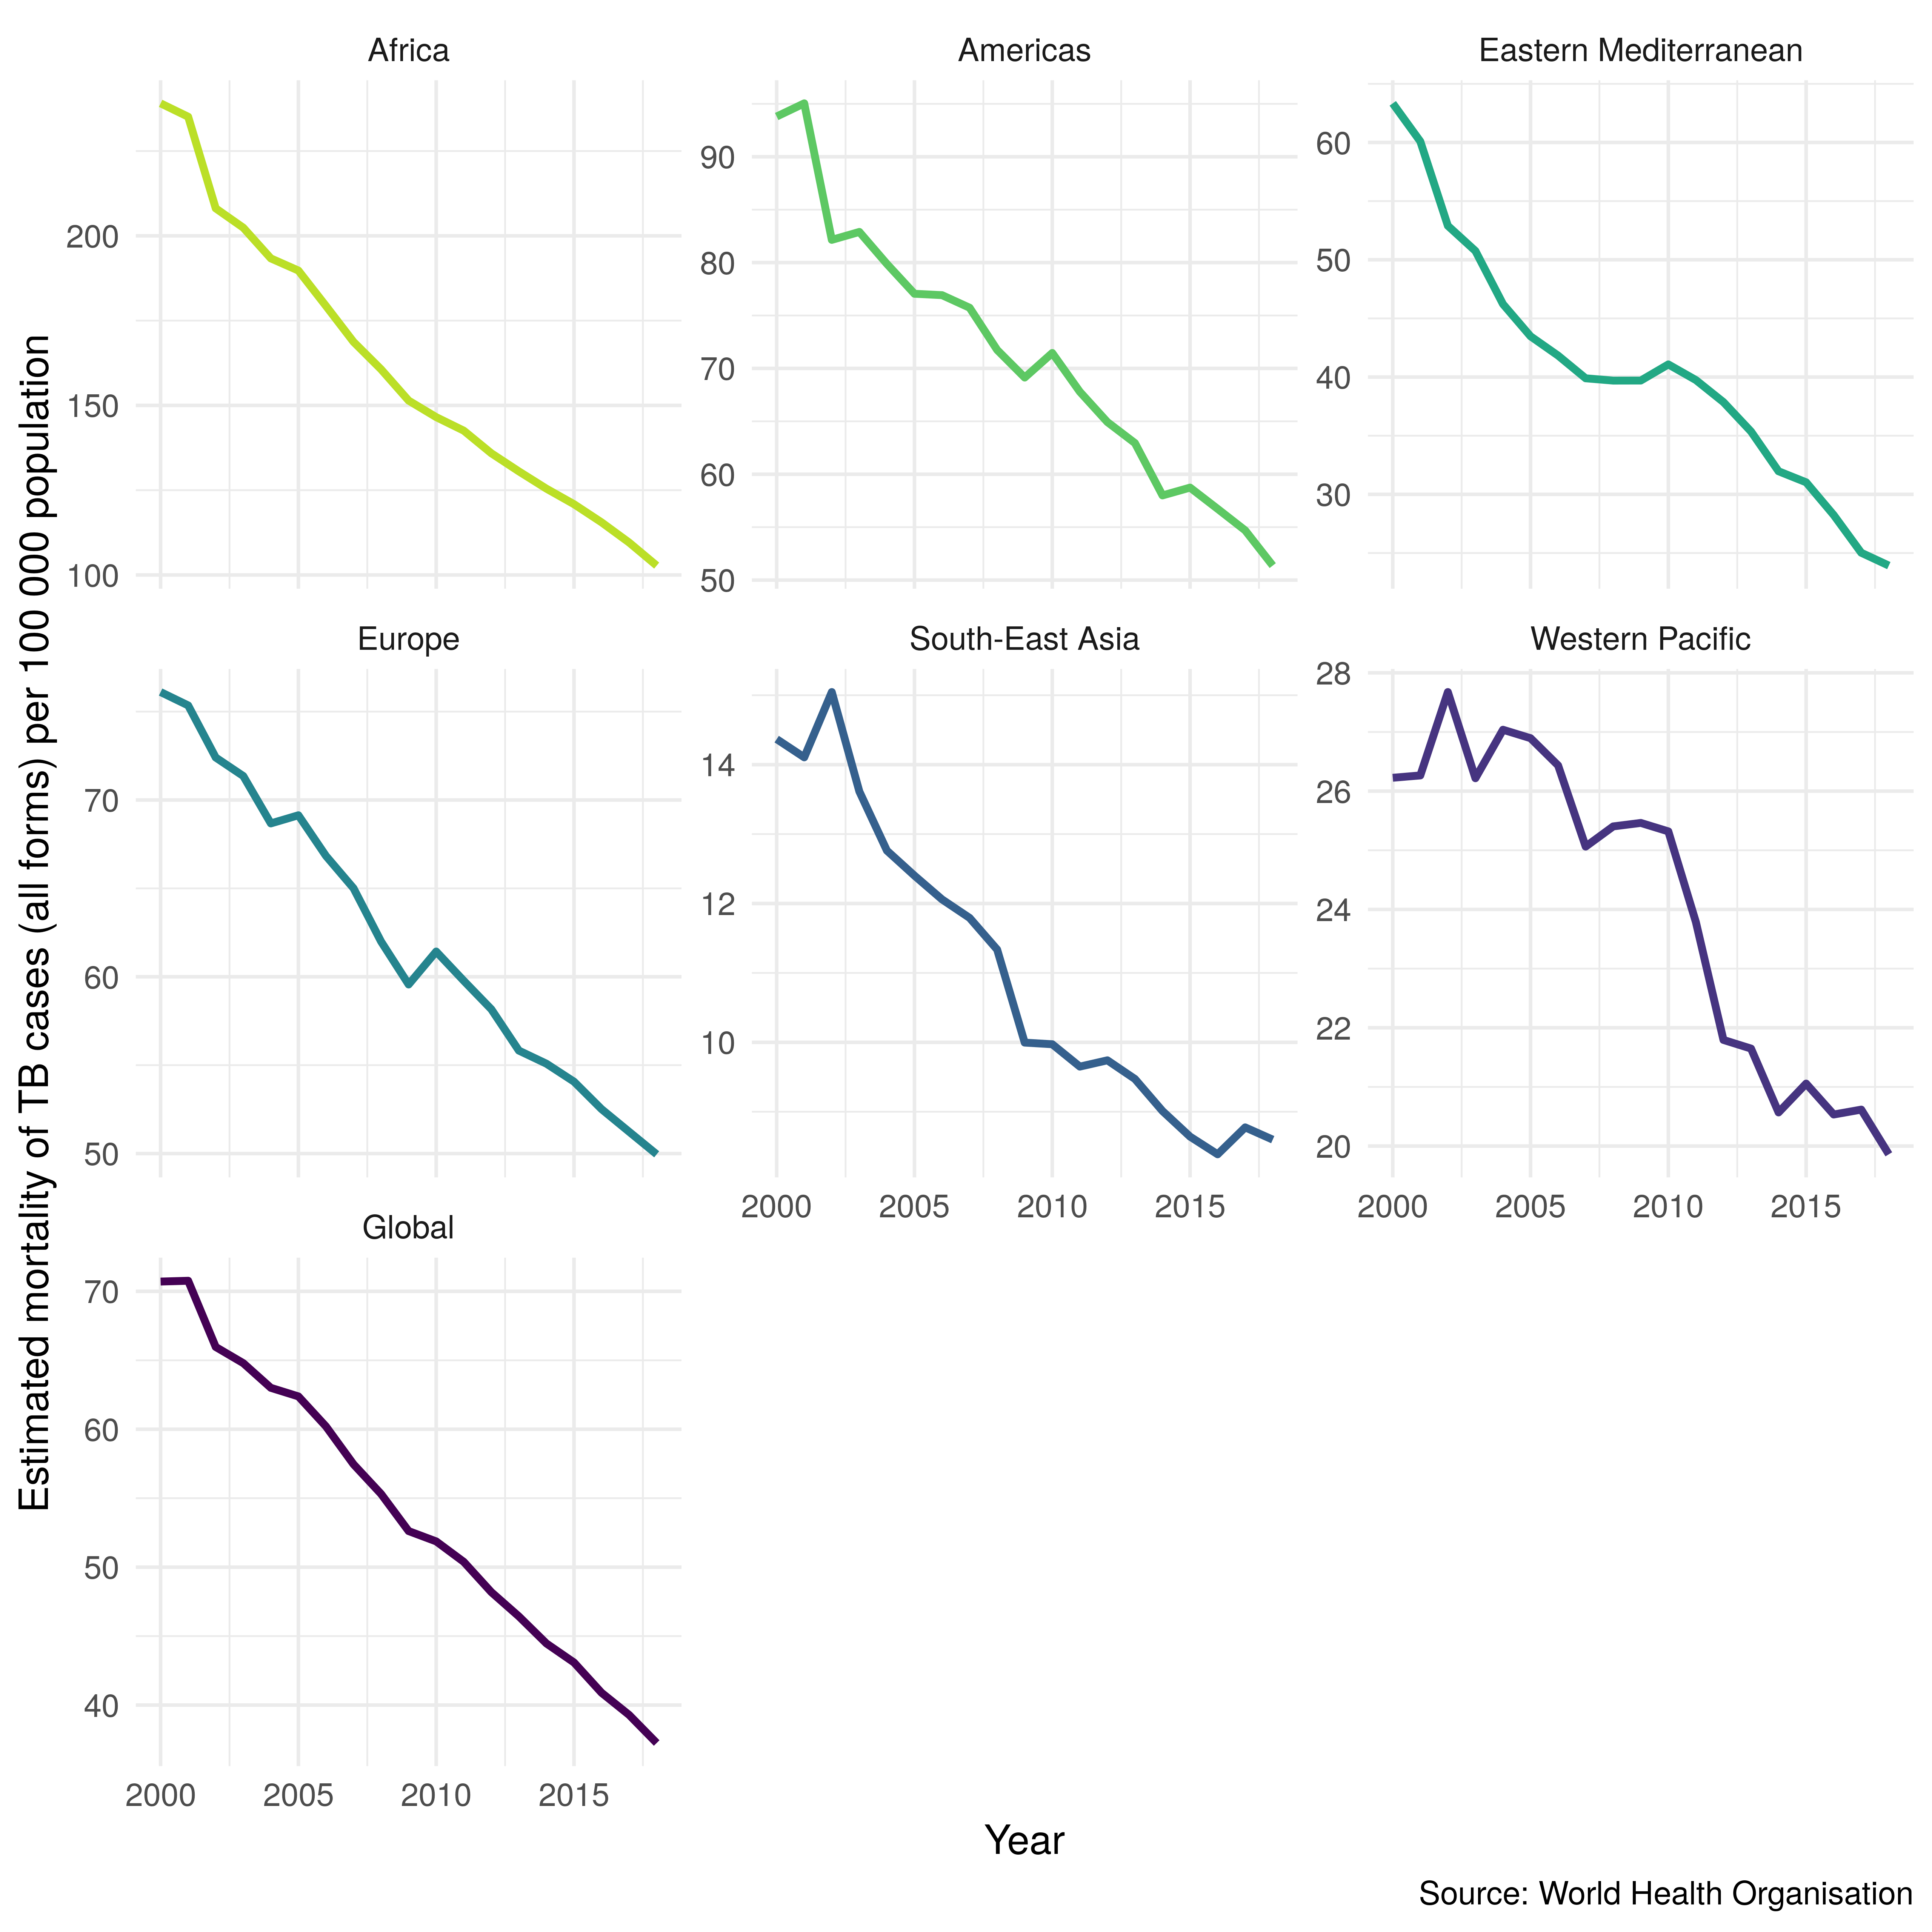
Figure 2.3: TB mortality rates (per 100,000 cases) by region and globally from 2000 until 2017. Mortality rates from TB have been falling in all regions since 2000.
There is an ongoing global co-epidemic of HIV and TB, with people living with HIV accounting for 1.4 million TB cases in 2016. 22% of deaths from TB were in those living with HIV. Whilst this is a global problem, it is a particular issue in sub-Saharan Africa with over 60% (95% confidence interval (CI): 55%-64%) of incidence TB cases in South Africa also having HIV (Figure 2.4). This compares to a global mean of 9.1% (95% CI: 6.0%-13.0%) and a mean of 26.7% (95% CI: 17.4%-38.1%) in Africa.
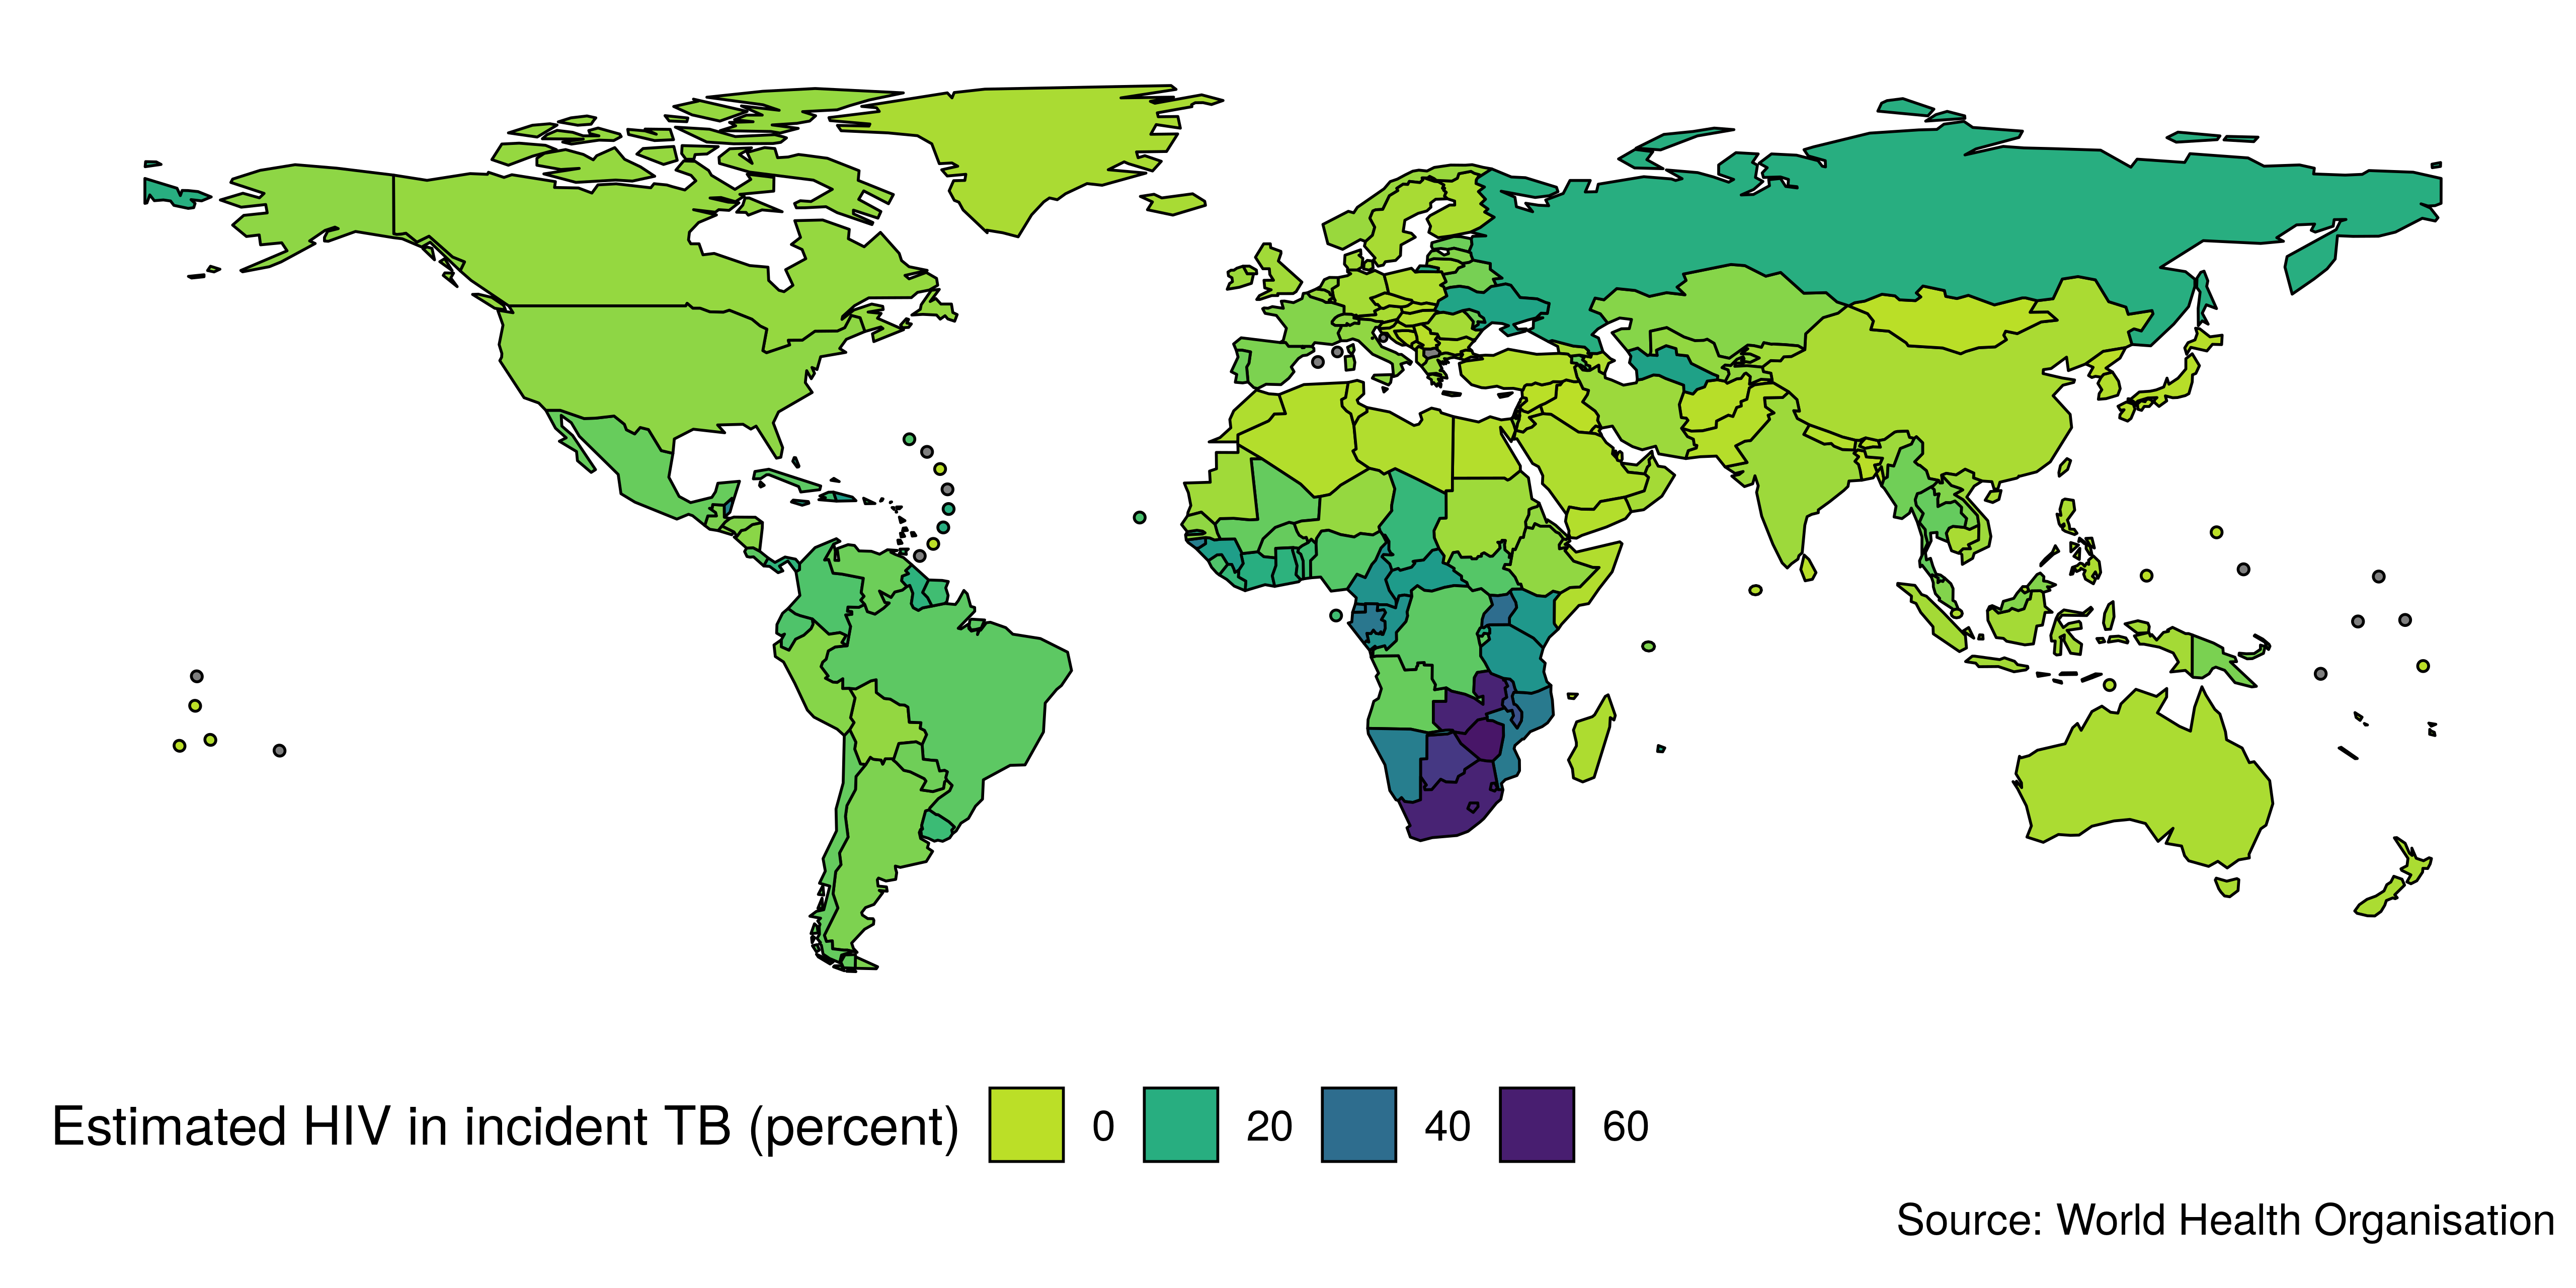
Figure 2.4: Global map of estimated HIV in incidence TB (percent) in 2018. Note the high percentage of TB cases with HIV in sub-saharan Africa. The percentages of HIV in incident TB in the legend refer to the lower bound for each colour.
Multi-drug-resistant TB (MDR-TB), which is defined as being resistant to at least isoniazid and rifampin, made up 4.6% of all incident TB cases globally in 2015 (480,000). It can be acquired both through treatment failure and through transmission. Treatment requires the use of second line antibiotics, which often have more severe side effects and are more likely to fail, with only 52% successfully treated globally compared to 83% for drug susceptible TB.[18] As for HIV co-infection, drug resistance is globally heterogeneous with some regions, like countries in the former USSR, having a much higher proportion of drug resistant cases. Figure 2.5 shows the country level proportion of cases with at least rifampicin resistance and highlights the higher level of rifampicin resistance in countries formerly in the USSR. 92% of rifampicin cases in Russia in 2018 also had MDR-TB, which is comparable to the global median of 81% (Table 2.2). Across all regions, Europe had the highest median percentage of rifampicin cases with MDR-TB (87%), with the Western Pacific having the lowest (78%).
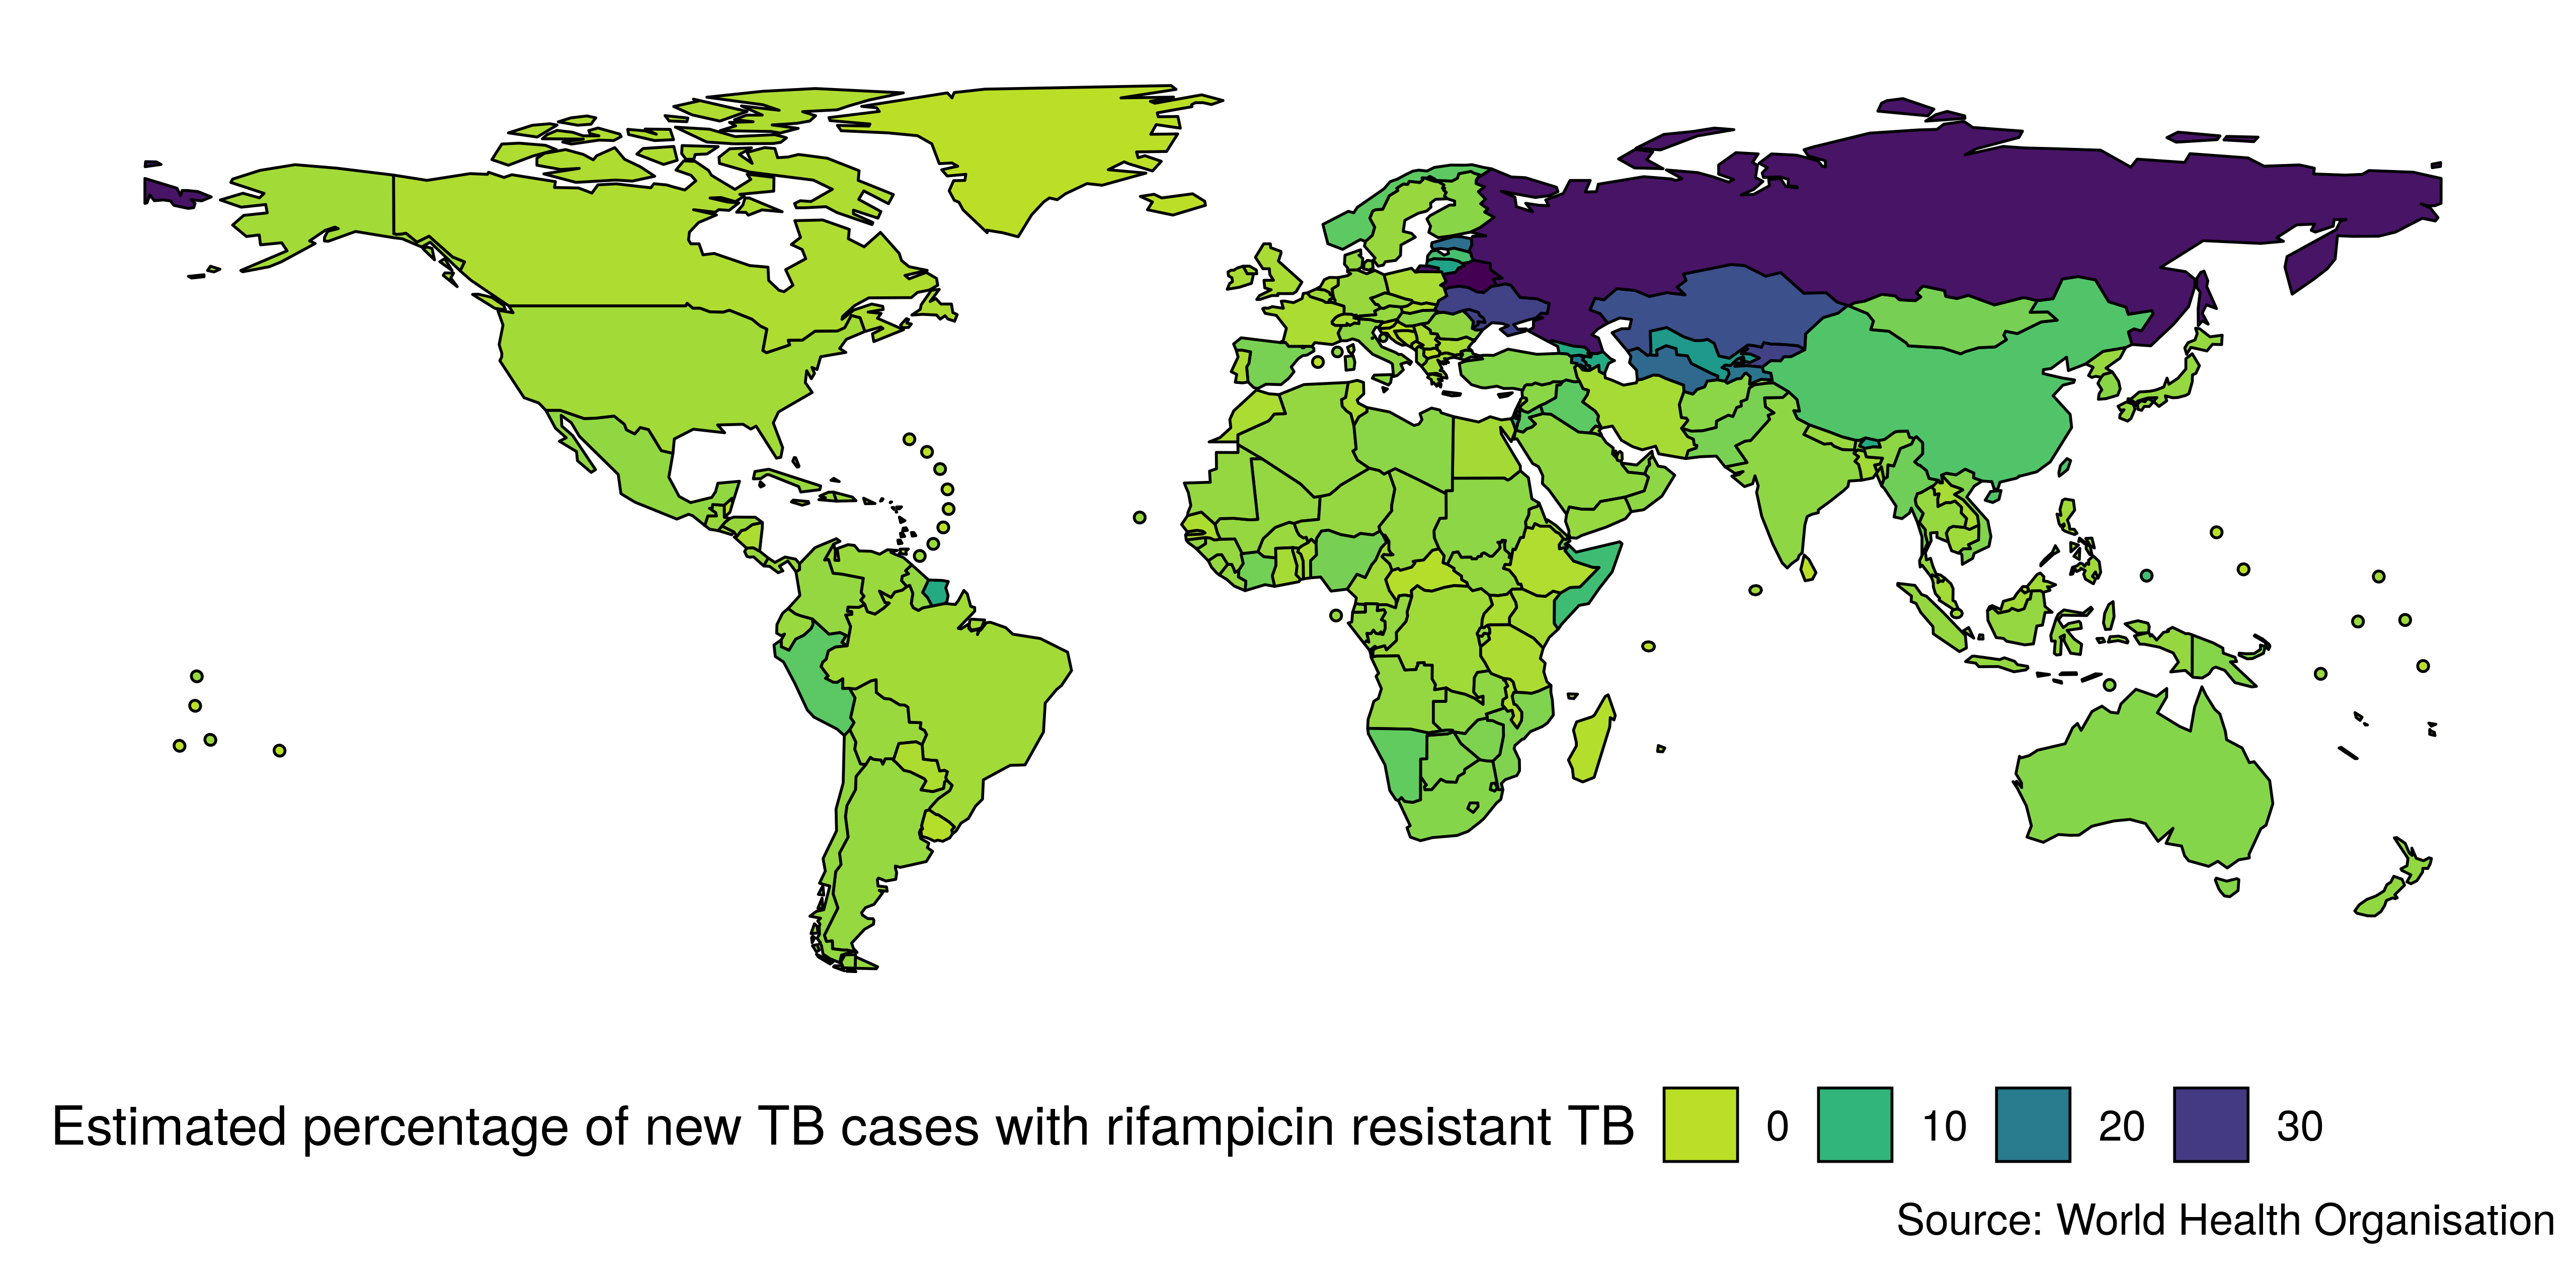
Figure 2.5: Global map of the estimated percentage of new TB cases with rifampicin resistance (percent) in 2018. Note that a far higher percentage of TB cases have rifampicin resistance in the former Soviet Union that in the rest of the world. The percentages of rifampicin resistances in incident TB in the legend refer to the lower bound for each colour.
| WHO region | Median Proportion of Rifampicin resistant cases with MDR* (2.5% to 97.5% quantiles) |
|---|---|
| Global | 81.0 (6.8 to 100.0) |
| Western Pacific | 78.0 (0.0 to 100.0) |
| South-East Asia | 100.0 (77.0 to 100.0) |
| Europe | 87.0 (17.2 to 100.0) |
| Eastern Mediterranean | 83.0 (29.5 to 100.0) |
| Americas | 73.0 (34.2 to 93.9) |
| Africa | 81.0 (50.5 to 100.0) |
| Russian Federation | 92.00 *** |
| ** Multi-Drug Resistant TB | |
| *** Only point estimates available |
All statistics that are not referenced in this section were generated using getTBinR - see Chapter 3 for further details.
2.1.5 TB in the England and Wales
2.1.5.1 TB Notifications
TB incidence in England and Wales has decreased dramatically from a century ago (Figure 2.64). However, in the past several decades, incidence rates first stabilised and have since increased since their lowest point in the 1990s. In 2000 there were 6044 notified TB cases in England, increasing to a maximum of 8280 notified TB cases in 2011. Since then, notifications have declined year-on-year.[20] Figure 2.6 includes the interventions discussed above (Table 2.1) and indicates that the introduction of several antibiotics and BCG vaccination in the 1950s may have led to an extended decrease in incidence.
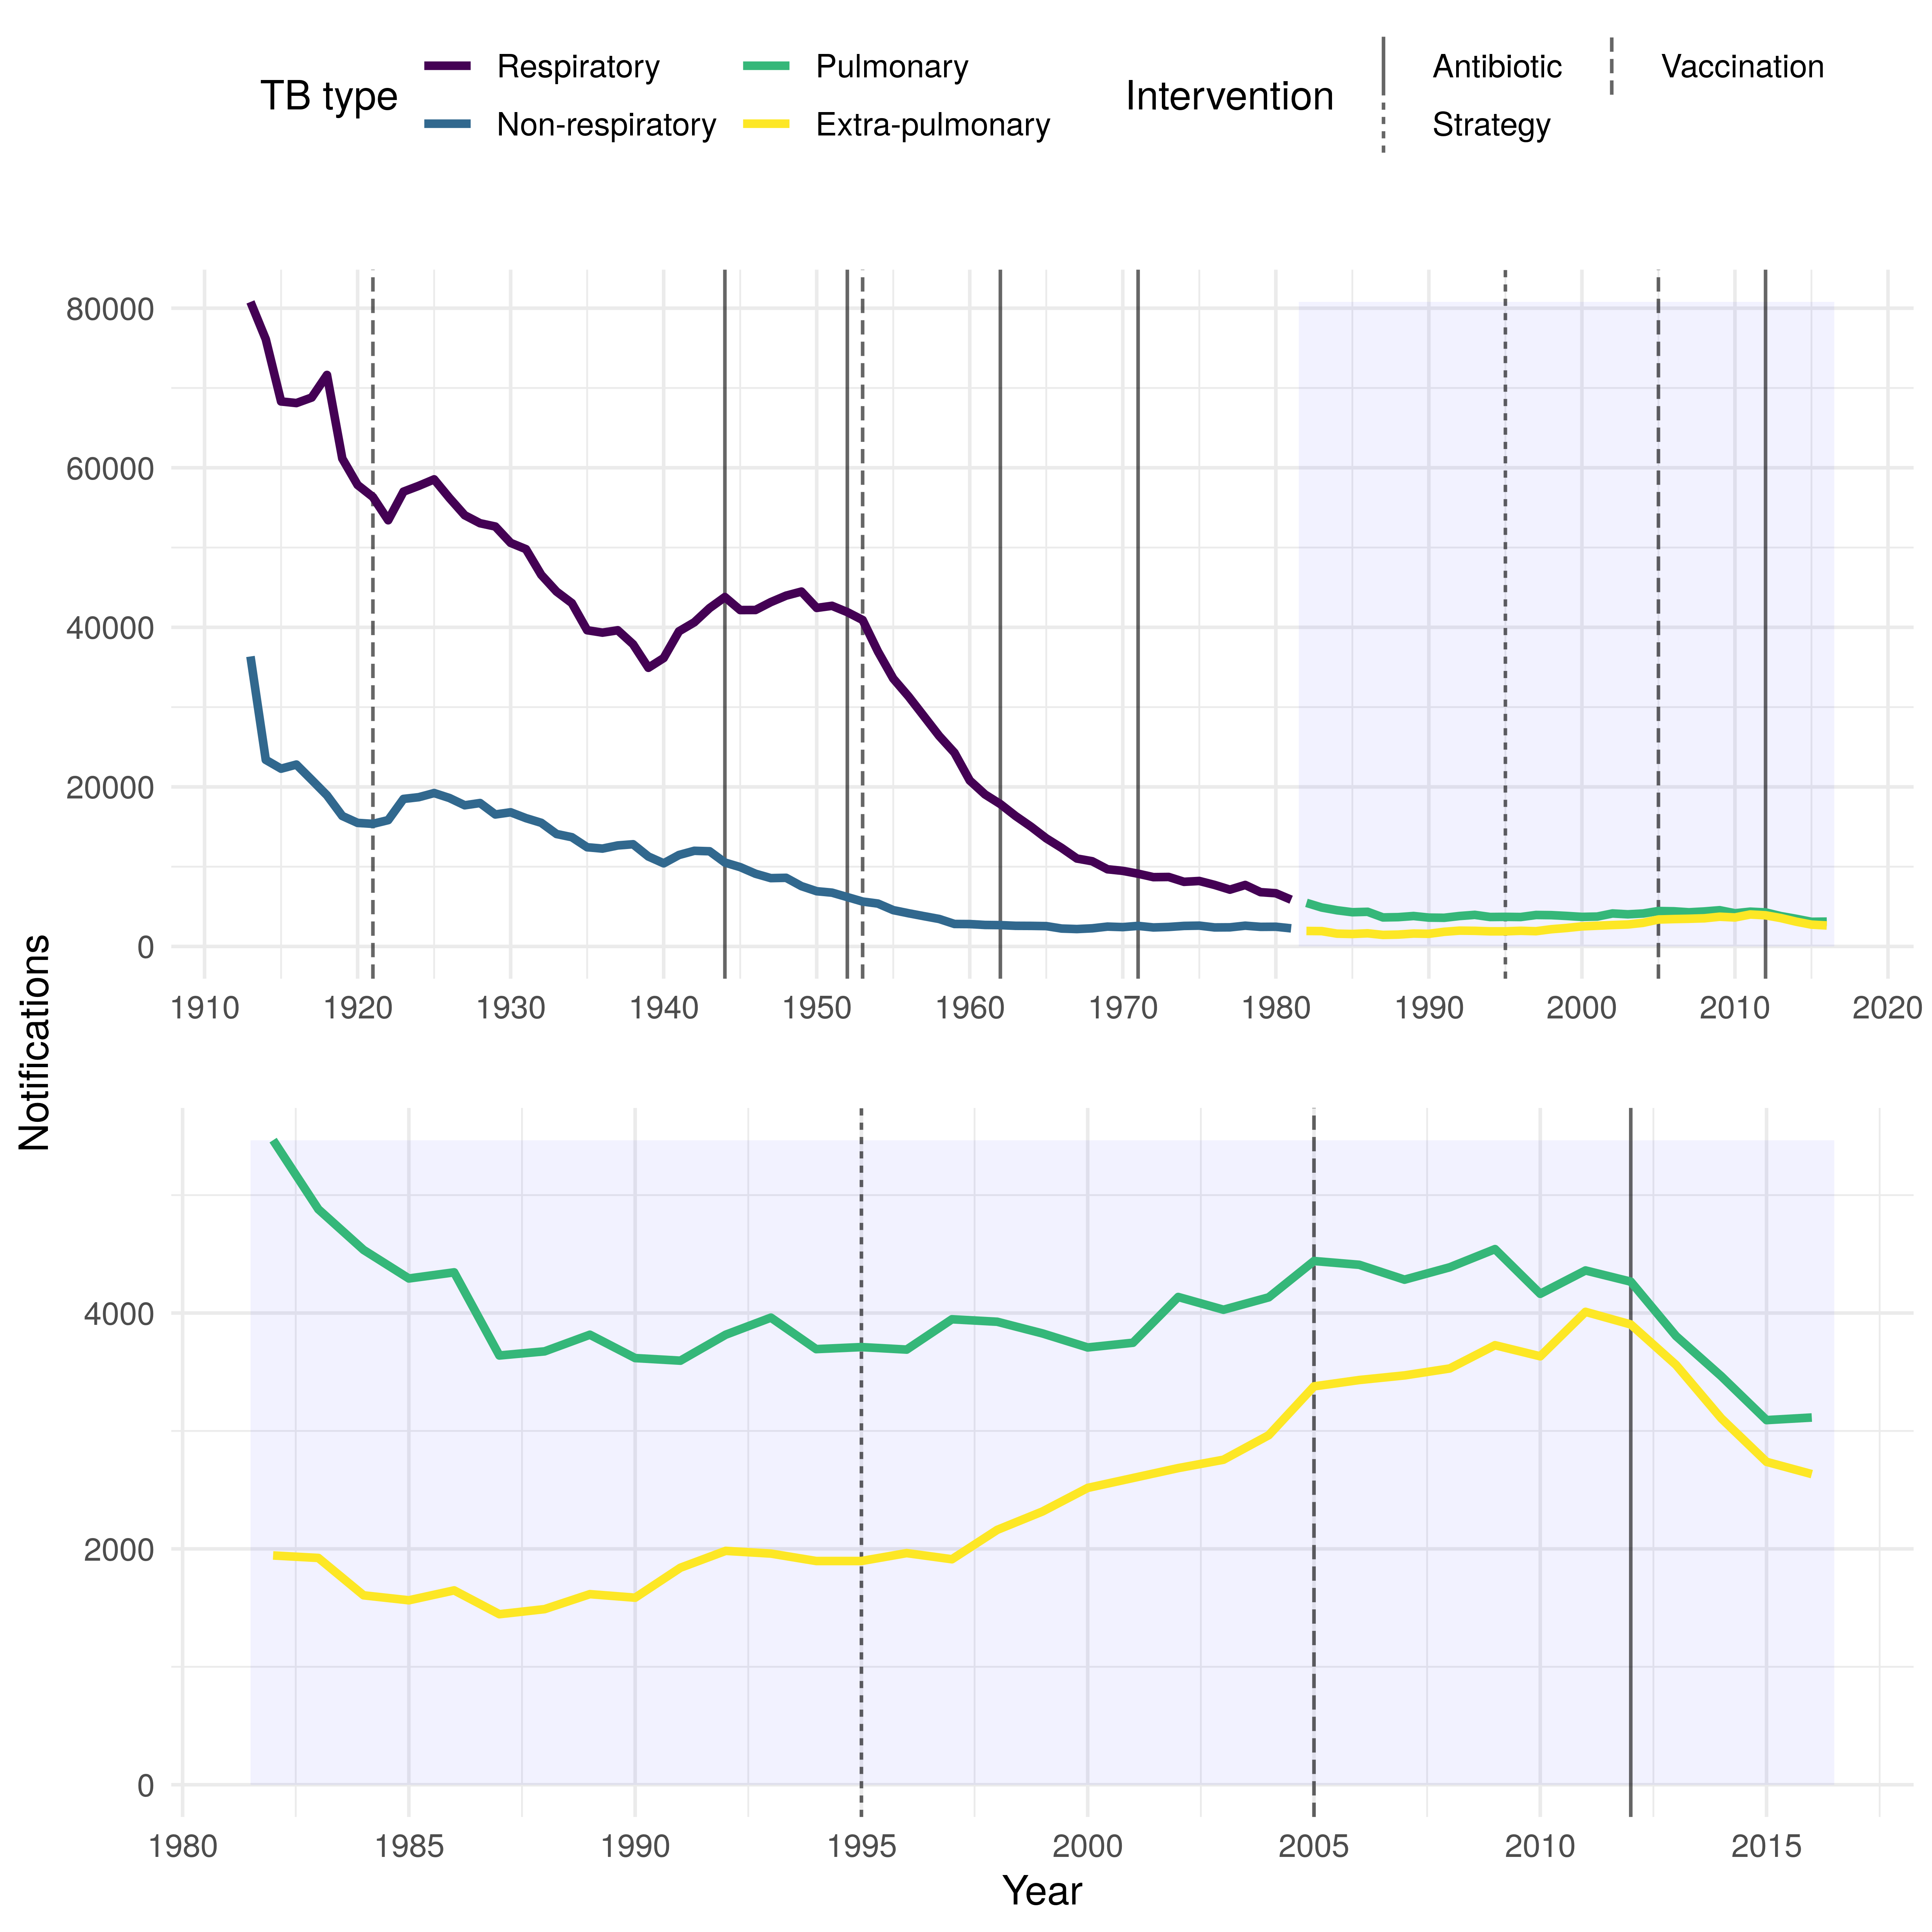
Figure 2.6: TB notifications in England and Wales from 1913 to 2017, stratified initially by respiratory/non-respiratory status and from 1982 by pulmonary/non-pulmonary TB. Interventions are highlighted with vertical lines, with linetype denoting the type of intervention, more information on each intervention is available in the corresponding table.
2.1.5.2 Heterogeneity of TB
TB incidence in England and Wales is highly heterogeneous with over 70% of cases occurring in the non-UK born population. Incidence rates in the non-UK born (49.4 per 100,000, in 2016) are 15 times higher than in the UK born population (3.2 per 100,000, in 2016).[2] The age distribution of cases in the UK born and non-UK born populations differ, with the UK born population having a relatively uniform distribution. Meanwhile, the non-UK born have higher incidence rates in those aged 80 years and older (69.3 per 100,000 in 2016), those aged 75 to 79 years (62.9 per 100,000 in 2016) and those aged 25-29 years old (61.6 per 100,000 in 2016) [2]. In the non-UK born, the majority of cases occur amongst those who have lived in the UK for at least 6 years (63%) - this has increased year-on-year since 2010 (when it was 49%).[2] 23.3% (420/1,800) of non-UK born cases had traveled outside the UK in 2016 with the majority returning to their country of origin. Incidence rates in the UK born are between 3 and 14 times higher in non-White ethnic groups compared to the White ethnic groups.[2]
The majority of cases occur in urban areas. London alone accounts for 39% of cases, with an incidence rate of 25.1 (per 100,000, in 2016).[2] England has few cases of MDR-TB cases, with only 68 cases recorded in 2016. Similarly the number of co-infections with HIV is low with only 3.8% of cases in 2015 having HIV - the majority of these cases were born in countries with high HIV prevalence. In 2016, 11.1% of TB cases in 2016 had at least one social risk factor, compared with 11.7% in 2015.[2] In general cases with social risk factors are more likely to have drug resistant TB, worse TB outcomes, and to be lost to follow up.[2] Amongst cases who were of working age in 2016, with a known occupation; 35.2% (1,491/4,240) were not in education or employment, 10.2% (432) were either studying or working in education; and 7.1% (304) were healthcare workers.[2]
2.1.5.3 TB Transmission
As TB incidence rates alone cannot be used to assess current TB transmission, due to reactivation of those latently infected, the incidence rate in UK born children (0-14 years old) is often used as a proxy for transmission. Incidence rates in UK born children have fallen 47% from 3.4 per 100,000 in 2008 to 1.8 per 100,000 in 2016.[2] This indicates that TB transmission has fallen in the last decade. However, BCG vaccination was introduced for those neonates at high risk of TB in 2005, which may partly be responsible for the observed reduction in incidence rates.
Strain typing or whole genome sequencing is used to establish case clustering. This can be used to rule out transmission between cases, but does not necessarily confirm transmission. Approximately 60% of cases cluster with at least one other case, and whilst this varies year-on-year, the fluctuations appear to be small (approximately 1-2%).[2] Therefore interpreting any trend in TB transmission from the current strain typing data is difficult. Between 2010 and 2016, the median cluster size was 3 cases (range 2-244). In these clusters, 74.4% (2,141/2,878) consisted of less than 5 cases and only 8.8% of clusters had more than 10 cases [2]. UK born cases were more likely to cluster than non-UK born cases (71.1%, 4,200/5,910 vs. 56.1%, 10,166/18,121).[2]
2.1.5.4 Pulmonary Vs. Extra-Pulmonary TB
Figure 2.7 shows that since the 1980s the proportion of extra-pulmonary TB has increased from 26.2% (1944/7410) in 1982 to 45.8% (2634/5748) in 2016. This may be attributed to the age distribution of TB cases changing as different age groups are more likely to progress to pulmonary vs extra-pulmonary TB. It may also be related to the increase of non-UK born cases as a higher proportion of non-UK born cases have extra-pulmonary disease only (51.4%, 2,103/4,089, in 2016), compared to UK born cases (31.9%, 467/1,465, in 2016).[2] For more details on TB in England, see Chapter 4 and the Public Health England 2017 and 2018 TB reports from which the summary data discussed above was extracted.[2,21]
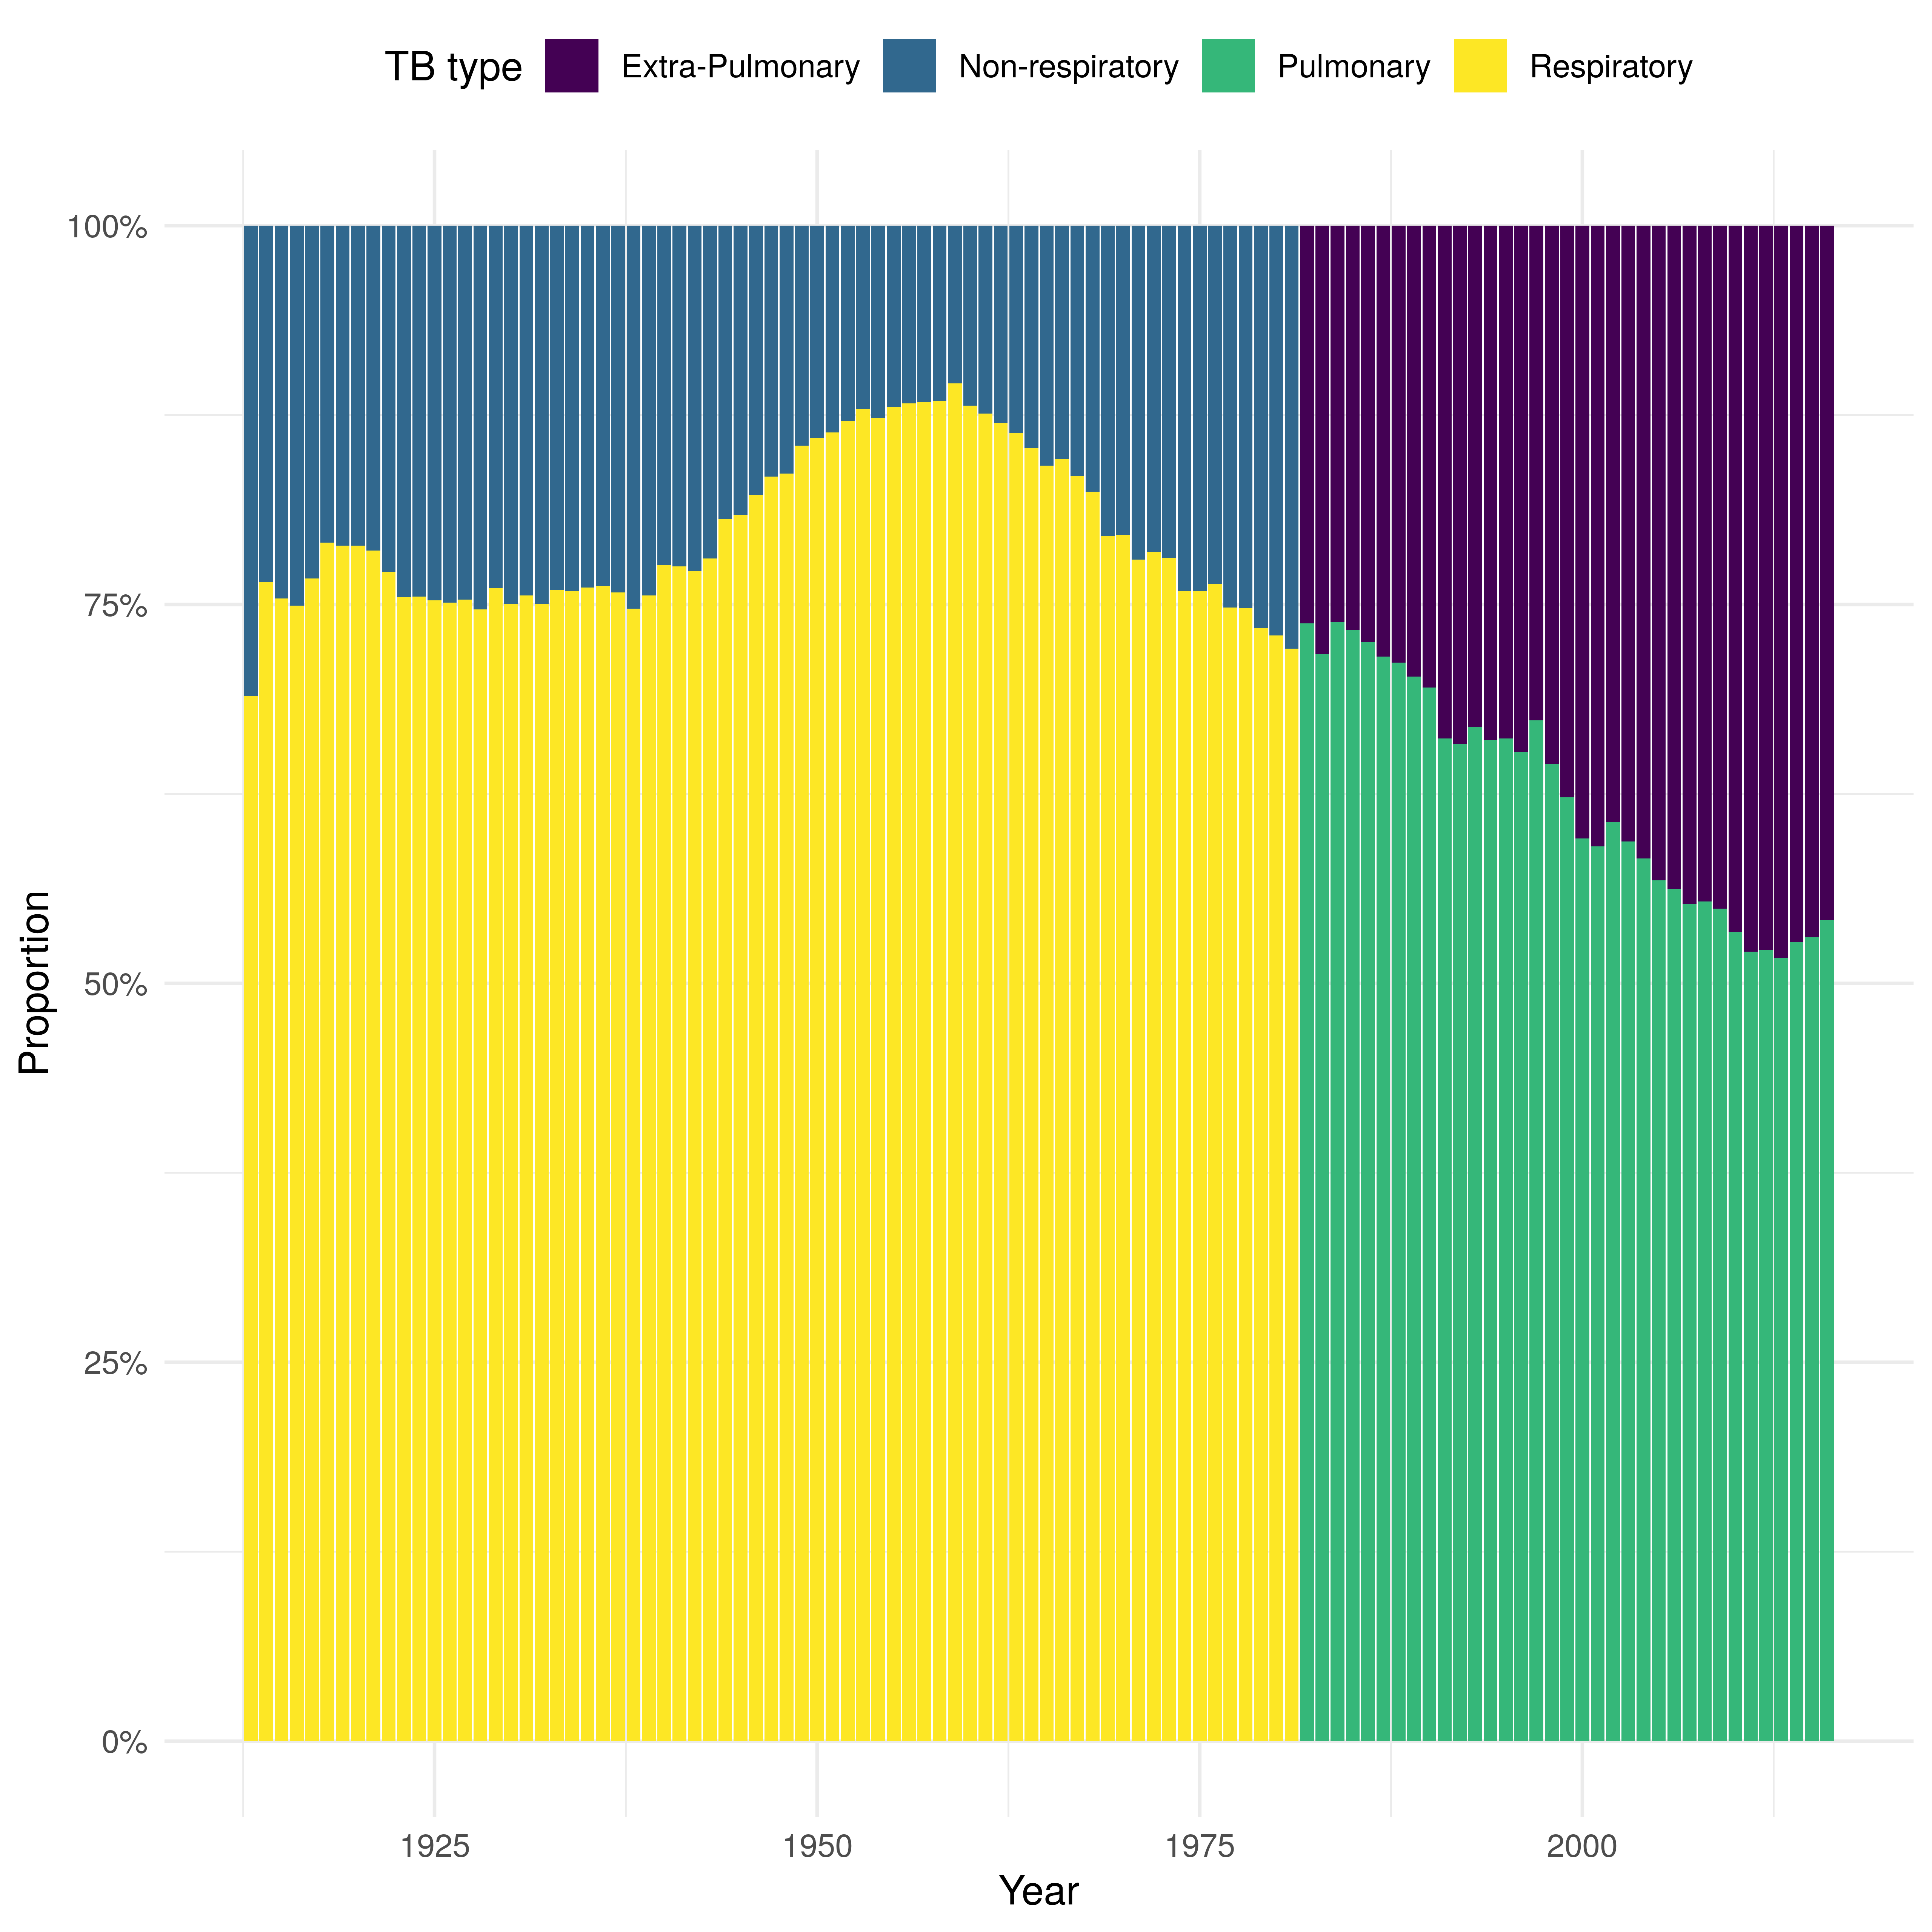
Figure 2.7: From 1913 until 1981 the figure shows the proportion respiratory vs. non-respiratory cases and from 1982 it shows the proportion of pulmonary vs. non-pulmonary TB.
2.2 The Bacillus Calmette–Guérin Vaccine
The Bacillus Calmette–Guérin (BCG) vaccine was first given to humans in 1921 and remains the only licensed vaccine for TB.[22] The BCG vaccine is a live vaccine and was developed by weakening a strain of Mycobacterium bovis, which is commonly found in cows, over a period of 13 years.[3] Serious side effects are rare, although a small scar at the injection site is common. Initially, public acceptance was slow, with low take up until after the Second World War. However, controversy remains and several countries have scaled back, or retargeted, their usage in recent years. This section details the action, effectiveness, duration of protection, effects and usage of the BCG vaccine.
2.2.1 Vaccine action
The BCG primarily acts by directly preventing the development of active, symptomatic disease. However, there is some evidence to suggest that the BCG vaccine also provides partial protection against initial infection.[4] There is no evidence that BCG vaccination of latent TB cases provides protection from developing active TB disease.[3]
2.2.2 Vaccine effectiveness
The effectiveness of the vaccine is impacted by the age at which it is given, the latitude of the individual, and the period of time that has lapsed since vaccination. Multiple randomized control studies (RCTs) have been conducted on BCG efficacy. It has consistently been shown to be highly protective in children for both pulmonary TB and TB meningitis.[23] Efficacy in adults ranges from 0% to 78%,[25] with an MRC trial in England finding that BCG was 78% effective in the White UK-born.[26] Effectiveness at preventing initial infection has been estimated at 19% (95% CI: 8% to 29%) globally.[4]
A meta-analysis of RCTs indicated that increased protection is associated with distance from the equator.[25] One hypothesis for this is that there is a greater density of mycobacteria near the equator that may mask, or block, the protection offered by the BCG vaccine.[27] Recently it has been found that much of this latitude effect may be due to the robustness of tuberculin skin testing (TST), with lower stringency near the equator.[3] TST screening tests for the presence of TB infection but may give a false positive if the subject has been exposed to other mycobacteria or the BCG vaccine. Reduced stringency would lead to a greater number of latent TB individuals being vaccinated. These individuals would then receive no protection from the vaccine and would lead to a reduced estimate of the effectiveness of the vaccine overall. Regardless of the mechanism this effect means that vaccination early in life maximises the protection conferred by the BCG vaccine in countries with evidence of decreasing protection with age.
2.2.3 Duration of protection
The effectiveness of the BCG vaccine has been shown to reduce over time.[28] However, there is good evidence that protection can last up to 10 years, with limited evidence of protection beyond 15 years.[28] Although, a recent study found that protection from active TB may extend later into life in England.[29] There is little evidence to suggest that re-vaccination boosts the protection offered by initial vaccination.[3]
The limited duration of protection has informed vaccination policy globally.[5] In countries where the BCG vaccination has been shown to be effective when given later in life, vaccination at school-age results in high levels of BCG effectiveness in young adults. As young adults are typically responsible for large amounts of TB transmission, this is likely to reduce TB incidence rates. Vaccination of neonates, on the other hand, provides protection against TB early in life. TB outcomes can be very poor at this time, but early life vaccination can lead to lower levels of protection later in life when transmission is more likely. This results in a trade-off, with BCG vaccination of neonates being more effective in low effectiveness settings and in settings with lower TB incidence rates, whereas school-age vaccination is potentially more effective in settings with high BCG effectiveness and higher TB incidence rates.
2.2.4 Additional effects of BCG vaccination
Until recently, little attention has been given to any additional effects of BCG vaccination.[30,31] However, there is now some evidence that BCG vaccination induces innate immune responses that may provide non-specific protection[32] and reduce all-cause neonatal mortality.[33,34] There is some evidence that this reduction in all-cause mortality extends later in life.[35] Additionally, BCG vaccination may improve outcomes for individuals with active TB disease. TB patients with BCG scars have been found to respond better to treatment with earlier sputum smear conversion (detection of TB bacterium in a sputum sample) .[36] There is also evidence to support an association between BCG vaccination and reduced TB mortality.[28] The evidence for additional effects of BCG vaccination on outcomes in individuals with notified TB, in England, is explored further in Chapter 6.
In addition to its effect on TB outcomes, the BCG vaccine has also been found to be effective at preventing leprosy (with a risk ratio (RR_ of 0.45 (95% CI: 0.34-0.56)), with some evidence that this protection was stronger in those vaccinated before 15 years of age.[3] Additionally, there is some evidence that the BCG vaccine can provide protection against Non-TB mycobacteria (NTM) infections, with an estimated effectiveness of 50%.[3] This protection has been shown to greatly reduce the incidence of NTM lymph node inflammation and protect against Buruli ulcers for the first 12 months following vaccination (RR, 0.50 [95% CI, 0.37–0.69]). A study also found that individuals with Buruli ulcers are less likely to develop osteomyelitis (bone infection) if they have a BCG scar (RR, 0.36 (95% CI: 0.22 to 0.58)).[37]
2.2.5 Usage globally
The BCG vaccine is one of the mostly widely-used vaccines worldwide, with approximately 100 million doses given annually.[38] However, due to the variable estimates of BCG efficacy, vaccination has been controversial since its development. The WHO recommends vaccination for all neonates as early as possible after birth in high burden settings. Vaccination in low burden settings is dependent on the country specific epidemiology of TB.[3,39] This recommendation is based on the strong evidence that the BCG is highly protective in children (particularly against disseminated TB and TB meningitis),[23,24] whilst its effectiveness has been shown to vary with latitude when given later in life.[40] Historically, different strategies have been utilized worldwide. These include universal vaccination of those at most risk of onwards transmission and high-risk group vaccination targeting either neonates or children.[28]
In addition, BCG vaccination policies have differed by the number of doses given, the method of application (although most countries now use the intradermal route), and the strain type used.[5] Policies have also changed over time within countries due to changes in evidence, global best practice, TB incidence rates and HIV incidence. This means that in order to understand the current impact of BCG vaccination in a population it is important to know both the current vaccination policy but also historic vaccination policies.
As of 2011, among 180 countries with available data, 157 countries recommended universal BCG vaccination. The remaining 23 countries had either never implemented a universal programme or have switched to targeted vaccination of high risk individuals.[5] Most countries began universal programmes between the 1940s and 1980s due to high levels of TB incidence and strong evidence of the effectiveness of the BCG vaccine.[26] In the last 20 years 49 of these countries reported changing their vaccination programme with 27 countries reporting major changes in the last 10 years.[5] Globally, in countries that have BCG vaccination policies in place, coverage is thought to range from 70% to 100%.
2.2.6 Usage in England
In England, universal school-aged vaccination was introduced after an MRC trial in the 1950s estimated BCG’s effectiveness at 78% in the white UK born population.[26] In 2005, the UK shifted from this strategy to targeted vaccination in neonates deemed at high risk.[28] This change was a reflection of current WHO vaccination policy,[39] falling TB incidence rates, an increasing proportion of TB cases occurring in the non-UK born,[2] and modelling evidence that suggested stopping the BCG schools scheme would have minimal long term effects on incidence rates.[41] The impact of this change in policy is explored throughout this thesis but in particular in Chapter 5, Chapter 7 and Chapter 10.
Since 2015, BCG vaccination has been included in the Cover Of Vaccination Evaluated Rapidly (COVER) programme, allowing coverage to be estimated in areas of England with universal vaccination (implemented due to high incidence rates and based on WHO guidelines). Coverage for areas in England implementing targeted vaccination remains unknown. In London, current coverage estimates are made by Local Authority and range from 5.3% to 92.1%.[2] These estimates may not be reliable as COVER has only relatively recently begun to include returns for BCG, meaning that data quality may be poor. Prior to the switch to targeted neonatal vaccination, coverage in those at school leaving age was thought to be approximately 75%.[41]
2.2.7 Replacement vaccines
Multiple replacement vaccines are currently in clinical trials.[5,42] Vaccine candidates include both live and sub-unit vaccines. Many of these candidate vaccines serve as a boost to the BCG vaccine, with the BCG vaccine being administered prior to the candidate vaccine.[5] Several BCG replacements are also being trialed, both based on alternative methods of attenuating TB mycobacteria and using other approaches.[42] However, in the short-to-midterm it is unlikely that a new vaccine will replace the BCG vaccine. This means that its optimal usage is as important as ever.
2.3 Summary
This chapter provides an overview of the natural history, risk factors, treatment, global epidemiology, and epidemiology in England and Wales of TB.
This chapter also details the action, effectiveness, duration of protection, effects and usage of the BCG vaccine. The only licensed vaccine for TB.
Motivation is given for the remaining chapters in this thesis.
References
2 Public Health England. Tuberculosis in England 2017 report ( presenting data to end of 2016 ) About Public Health England. 2017.
3 The World Health Organization. BCG vaccine:WHO position paper. Weekly epidemiological record 2018;1–24.
4 Roy A, Eisenhut M, Harris RJ et al. Effect of BCG vaccination against Mycobacterium tuberculosis infection in children: systematic review and meta-analysis. BMJ (Clinical research ed) 2014;349:g4643–3.
5 Zwerling A, Behr MA, Verma A et al. The BCG world atlas: A database of global BCG vaccination policies and practices. PLoS medicine 2011;8:e1001012.
11 Houben RMGJ, Dodd PJ. The Global Burden of Latent Tuberculosis Infection: A Re-estimation Using Mathematical Modelling. PLoS medicine 2016;13:e1002152–13.
12 Gideon HP, Flynn JL. Latent tuberculosis: What the host "sees"? Immunologic Research 2011;50:202–12.
13 Sepkowitz K. How contagious is tuberculosis? Clinical infectious diseases : an official publication of the Infectious Diseases Society of America 1996;23:954–62.
14 Rottenberg ME, Pawlowski A, Jansson M et al. Tuberculosis and HIV Co-Infection. PLoS Pathogens 2012;8:e1002464.
15 Bhatti N, Law MR, Morris JK et al. Increasing incidence of tuberculosis in England and Wales: a study of the likely causes. BMJ (Clinical research ed) 1995;310:967–9.
17 Story A, Murad S, Roberts W et al. Tuberculosis in London: the importance of homelessness, problem drug use and prison. Thorax 2007;62:667–72.
18 World Health Organization. Global Tuberculosis Report. 2016.
19 World Health Organisation. Global Tuberculosis Report. 2018.
20 PHE. Tuberculosis in England 2016 Report (presenting data to end of 2015). Public Health England 2016;Version 1.:173.
21 Public Health England. Tuberculosis in England: 2018. 2019;1–218.
22 Luca S, Mihaescu T. History of bcg vaccine. Maedica 2013;8.http://europepmc.org/articles/PMC3749764
23 Rodrigues LC, Diwan VK, Wheeler JG. Protective effect of BCG against tuberculous meningitis and miliary tuberculosis: a meta-analysis. International journal of epidemiology 1993;22:1154–8.
24 Colditz GA, Brewer TF, Berkey CS et al. Efficacy of BCG Vaccine in the Prevention of Tuberculosis. JAMA 1994;271:698.
25 Mangtani P, Abubakar I, Ariti C et al. Protection by BCG Vaccine Against Tuberculosis: A Systematic Review of Randomized Controlled Trials. Clinical infectious diseases : an official publication of the Infectious Diseases Society of America 2014;58:470–80.
26 Hart PDA, Sutherland IAN. BCG and vole bacillus vaccines in the prevention of tuberculosis in adolescence and early adult life. The American Statistician 1972;46:371–85.
27 Zwerling A, Behr MA, Verma A et al. The BCG World Atlas: a database of global BCG vaccination policies and practices. PLoS medicine 2011;8:e1001012.
28 Abubakar I, Pimpin L, Ariti C et al. Systematic review and meta-analysis of the current evidence on the duration of protection by bacillus Calmette-Guérin vaccination against tuberculosis. Health technology assessment 2013;17:1–372, v–vi.
29 Mangtani P, Nguipdop-Djomo P, Keogh RH et al. Original article The duration of protection of school-aged BCG vaccination in England : a population -based case control study. International journal of epidemiology 2017;0:1–9.
30 Fine P. Stopping routine vaccination for tuberculosis in schools. BMJ (Clinical research ed) 2005;331:647–8.
31 Teo SSS, Shingadia DV. Does BCG have a role in tuberculosis control and prevention in the United Kingdom? Archives of Disease in Childhood 2006;91:529–31.
32 Kleinnijenhuis J, Quintin J, Preijers F et al. Bacille Calmette-Guerin induces NOD2-dependent nonspecific protection from reinfection via epigenetic reprogramming of monocytes. Proceedings of the National Academy of Sciences of the United States of America 2012;109:17537–42.
33 Garly ML, Martins CL, Balé C et al. BCG scar and positive tuberculin reaction associated with reduced child mortality in West Africa: A non-specific beneficial effect of BCG? Vaccine 2003;21:2782–90.
34 Higgins JPT, Soares-weiser K, López-lópez JA et al. Association of BCG , DTP , and measles containing vaccines with childhood mortality : systematic review. BMJ (Clinical research ed) 2016;i5170.
35 Rieckmann A, Villumsen M, Sørup S et al. Vaccinations against smallpox and tuberculosis are associated with better long-term survival: a Danish case-cohort study 19712010. International journal of epidemiology 2016;0:1–11.
36 Jeremiah K, Praygod G, Faurholt-Jepsen D et al. BCG vaccination status may predict sputum conversion in patients with pulmonary tuberculosis: a new consideration for an old vaccine? Thorax 2010;65:1072–6.
37 Zimmermann, Petra, Finn, Adam, Curtis, Nigel. Does BCG Vaccination Protect Against Nontuberculous Mycobacterial Infection? A Systematic Review and Meta-Analysis. J Infect Dis 2018;218:679–87.
38 The World Health Organization. BCG Vaccine. Weekly epidemiological record 2004;79:27–48.
39 World Health Organization. Global Tuberculosis Report. 2017.
40 Mangtani P, Abubakar I, Ariti C et al. Protection by BCG vaccine against tuberculosis: A systematic review of randomized controlled trials. Clinical Infectious Diseases 2014;58:470–80.
41 Sutherland I, Springett VH. The effects of the scheme for BCG vaccination of schoolchildren in England and Wales and the consequences of discontinuing the scheme at various dates. Journal of epidemiology and community health 1989;43:15–24.
42 Schrager LK, Harris RC, Vekemans J. Research and development of new tuberculosis vaccines: a review. F1000Research 2018;7:1732–32.
or see http://www.seabbs.co.uk/shiny/TB_England_Wales for an interactive dashboard↩