Plot Historic TB Notifications in England and Wales
Source:R/plot_historic_tb_ew.R
plot_historic_tb_ew.RdPlot Historic TB Notifications in England and Wales
plot_historic_tb_ew(df = NULL, include_interventions = TRUE,
  df_interventions = NULL, zoom_date_start = 1982,
  zoom_date_end = NULL, plot_theme = NULL, colour_scale = NULL,
  return = FALSE)
Arguments
| df | A dataframe, (defaults to using |
|---|---|
| include_interventions | Logical, defaults to |
| df_interventions | A dataframe, (defaults to using |
| zoom_date_start | Numeric, the year to filter notifications from for the second zoomed plot. |
| zoom_date_end | Numeric, the year to end the zoom window, defaults to the final year of the data. |
| plot_theme | The ggplot2 theme to use, defaults to |
| colour_scale | The colour scale to plot with, defaults to |
| return | A logical indiciting if the plot should be printed or returned (defaults to |
Value
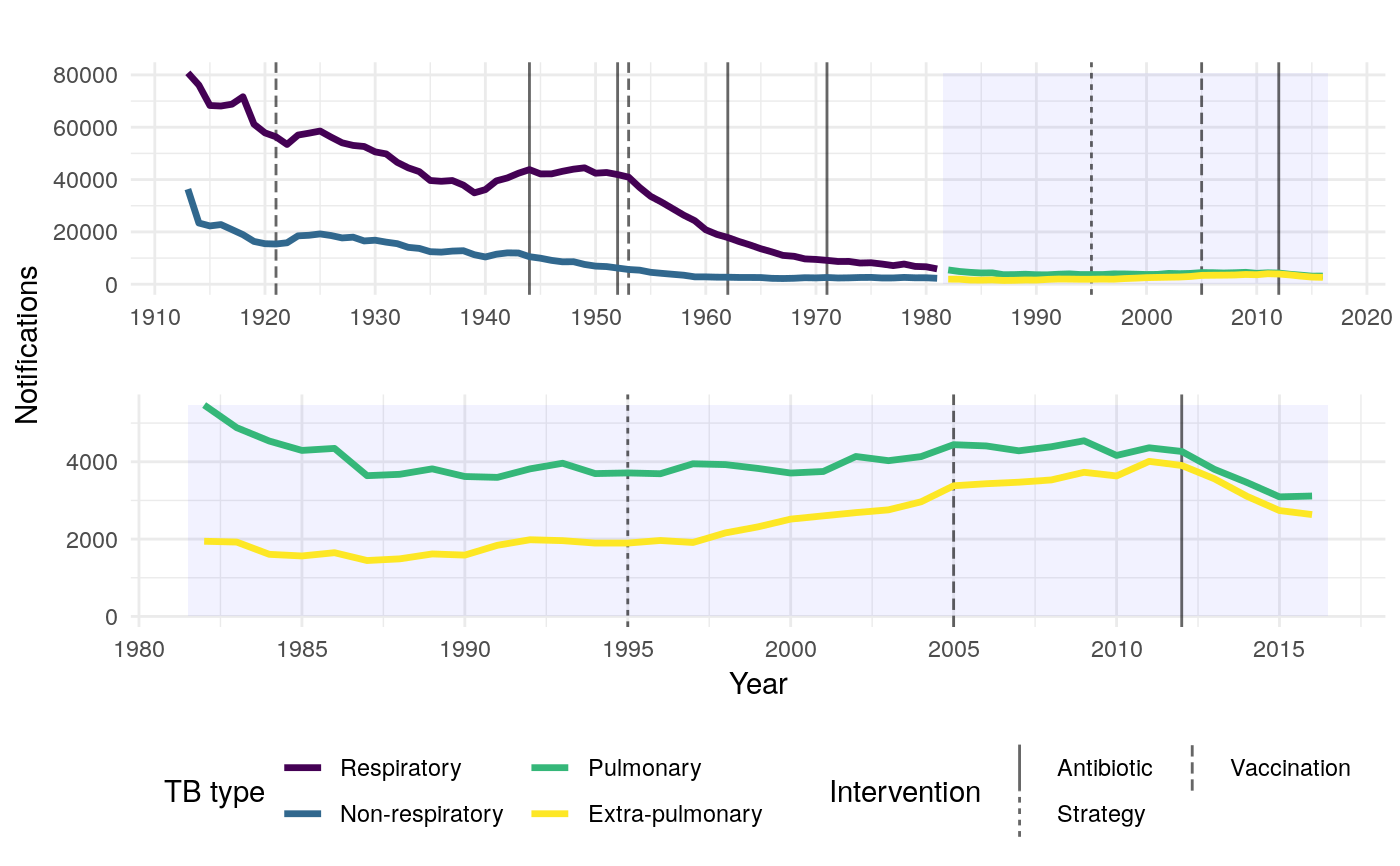
A ggplot2 plot of TB notifications over time, with a secondary zoomed plot from a specified date.
Examples
plot_historic_tb_ew()#> Warning: Removed 284 rows containing missing values (geom_path).