Adds World Health Organization-inspired colours as fills to plots
Source:R/scale_fill_who.R
scale_fill_who.RdApplies WHO inspired colours as a fill for ggplot2 plots. Currently a continuous
palette has not been implemented so the viridis palettes will be used as a fallback in this situation.
scale_fill_who(
  palette = "light",
  discrete = TRUE,
  reverse = FALSE,
  n = NULL,
  add_missings = FALSE,
  ...
)
Arguments
| palette | A character string. the colours of choice, current options are "main", "light" and "misc" for mixed colours as well as "purple", "turquoise", "blue", "magenta", "brown", "misc", "green", and "red". |
|---|---|
| discrete | Logical, defaults to |
| reverse | Logical, defaults to |
| n | Number of colours desired. If a specific value is given which corresponds
to the length of a palette used in the 2019 WHO TB report, this palette is returned,
else the number of entries in the palette with the most colour options (up to its
full length) is returned. Defaults to |
| add_missings | Add a grey and white colour to the palette, defaults to |
| ... | Pass additional arguments to |
See also
scale_colour_who who_palettes
Author
Maria Bekker-Nielsen Dunbar
Sam Abbott
Examples
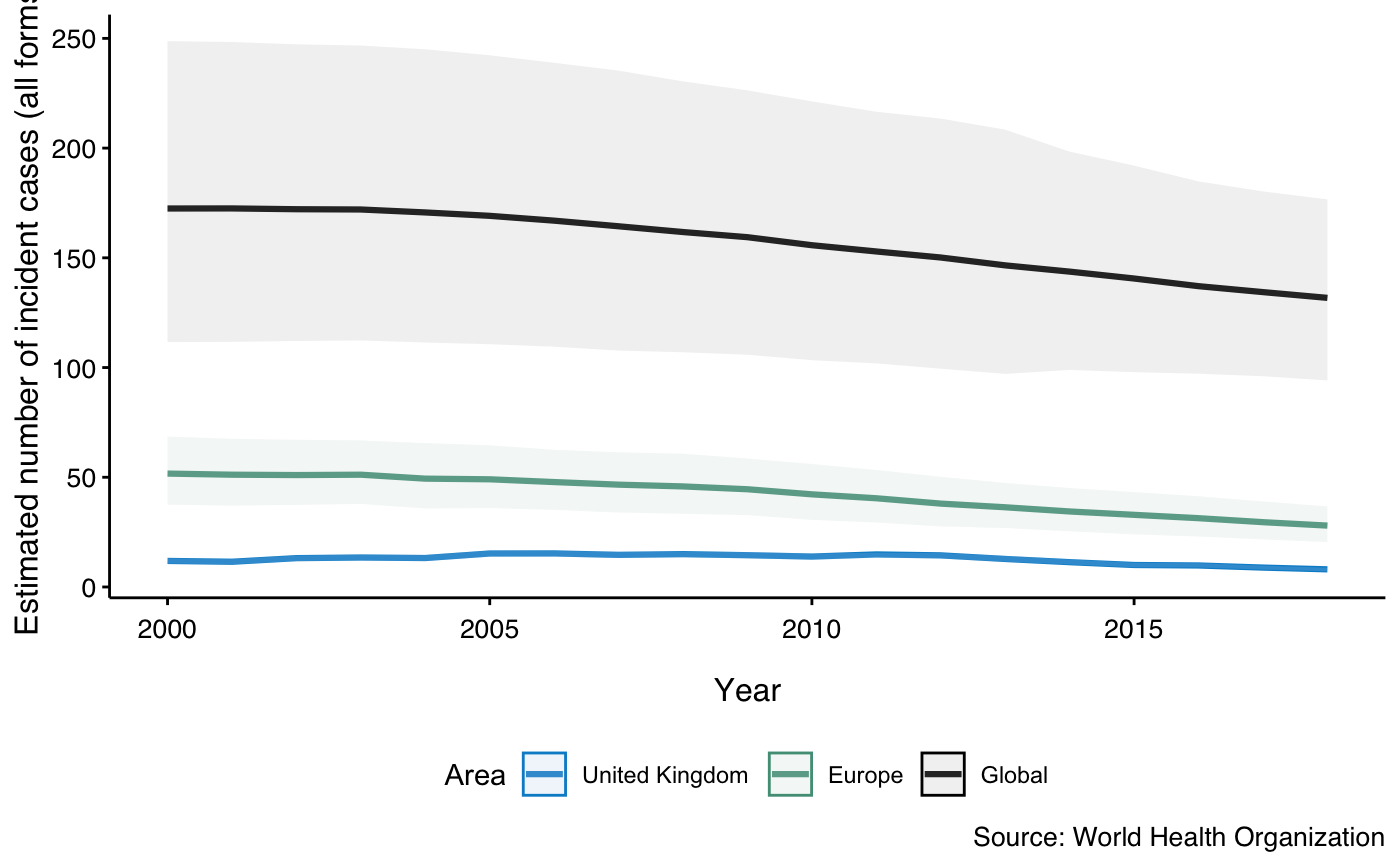
plot_tb_burden_summary( countries = "United Kingdom", compare_all_regions = FALSE, compare_to_region = TRUE, verbose = FALSE ) + theme_who() + scale_colour_who(reverse = TRUE) + scale_fill_who(reverse = TRUE)#> #>#> #>